 Copyright © Michael Richmond.
This work is licensed under a Creative Commons License.
So, if you have an echelle spectrograph, and a big telescope which collects lots of photons, it should be pretty easy to detect motions of a star of less than 10 m/s, right?
Wrong.
There are many inconvenient truths that we have ignored up to this point. For example, humans live on the Earth. This causes problems in a number of different ways:
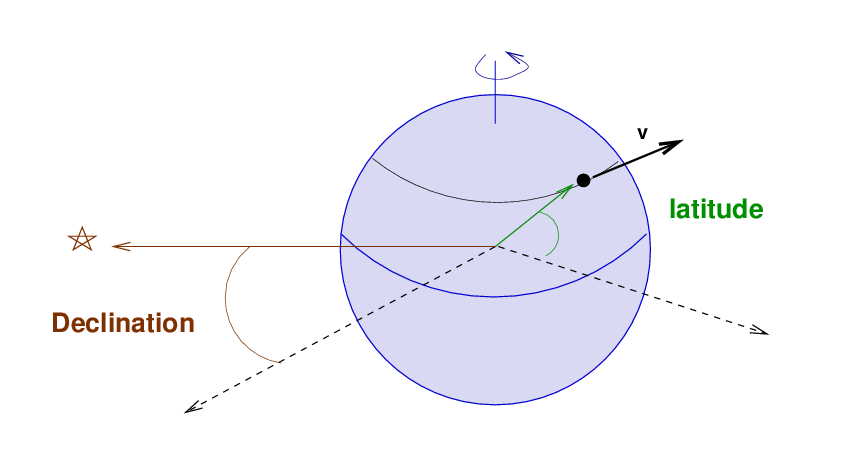
Let's continue to ignore the first couple of items, but look more closely at the final two. As we look at a star from a ground-based observatory, our telescope is carried along with the Earth's surface. The radial velocity of the telescope, relative to the star, depends on two items:

   Q:  What is the speed of the observatory v?


   Q:  What is the maximum possible component of that
       speed in the direction of the star?


   Q:  Can you come up with a single equation for the
       radial velocity of the observatory, as seen
       by the star?   What are the input parameters
       to this equation?
Of course, the Earth is also revolving in orbit around the Sun, and that motion, too, must be taken into account -- very, very carefully. Even small mistakes can turn out to be significant.
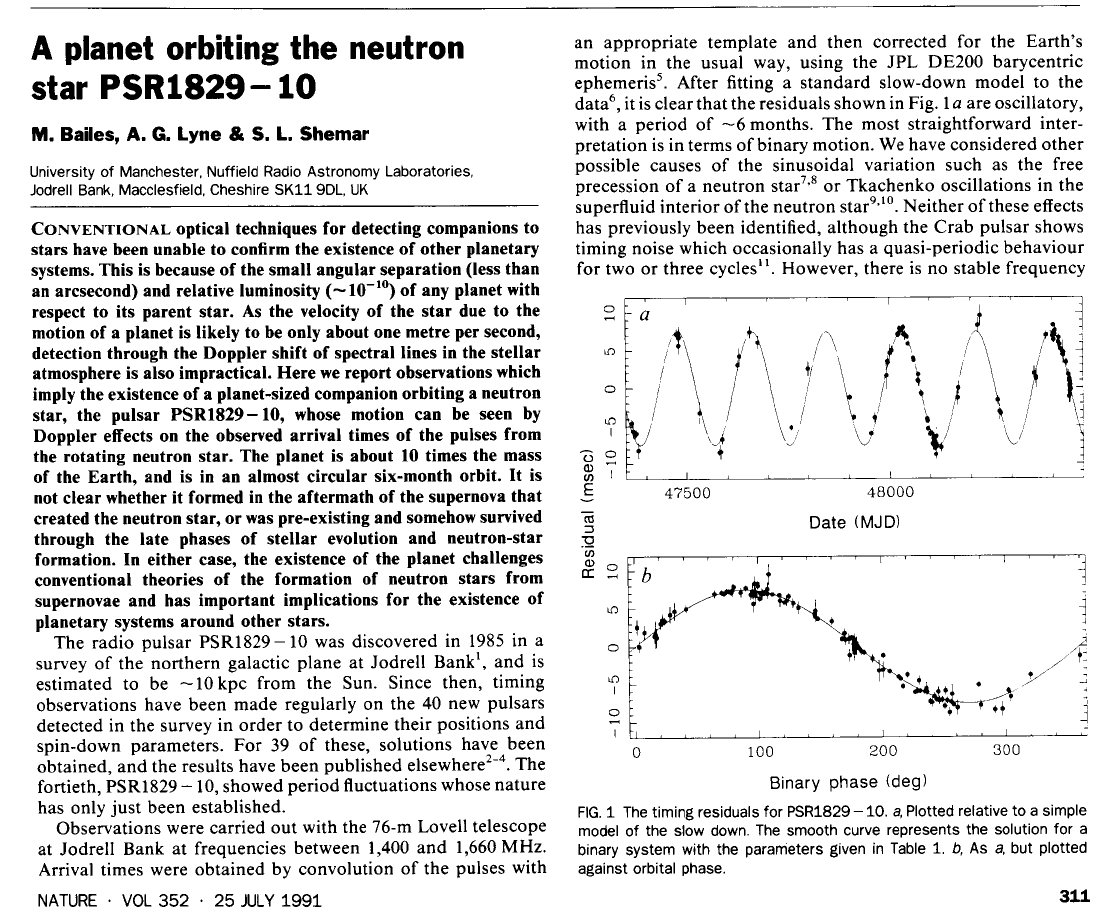
Taken from
Bailes, Lyne and Shemar, Nature 352, 311 (1991)
Less than a year later, as the New York Times reported, Lyne retracted this discovery at the January, 1992, meeting of the American Astronomical Society. You can read a short extract about the event in Strange New Worlds: The Search for Alien Planets and Life Beyond Our Solar System by Ray Jayawardhana, or another short extract taken from Pluto Confidential by Lawrence Marschall and Stephan Maran.
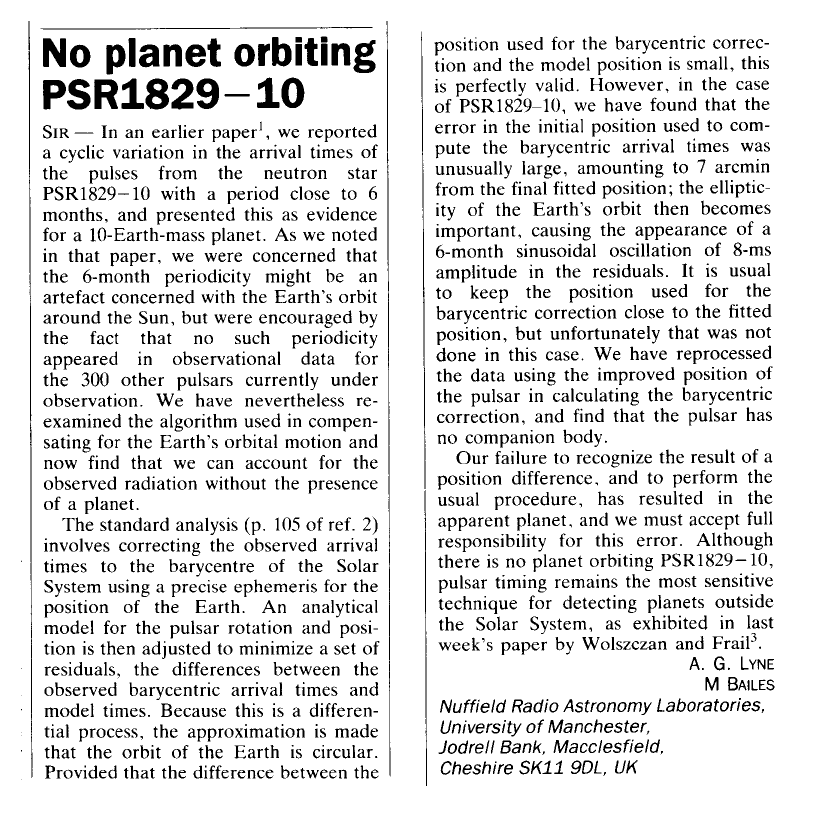
Taken from
Lyne and Bailes, Nature 355, 213L (1992)
So, we don't want to make a similar mistake. How can we compute the radial velocity component of the Earth's motion around the Sun?

   Q:  What is the speed of the Earth vorb?


   Q:  What is the maximum possible component of that
       speed in the direction of the star?


   Q:  Can you come up with a single equation for the
       radial velocity of the Earth, as seen
       by the star?   What are the input parameters
       to this equation?
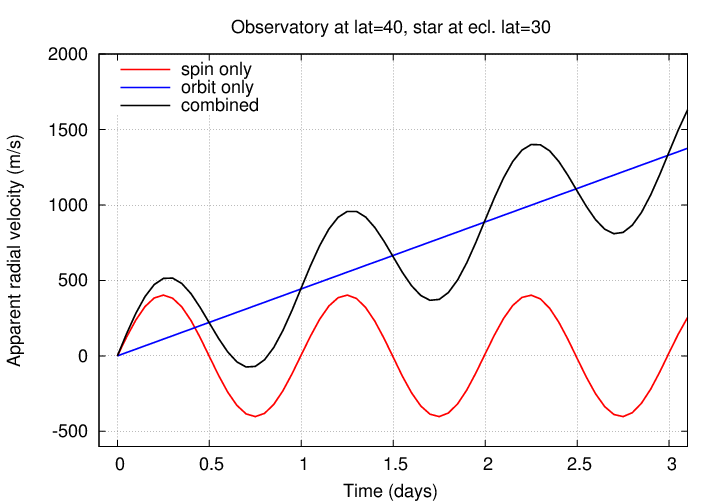
The effect of the Earth's spin alone is important on short timescales -- within a single night, or over several nights.
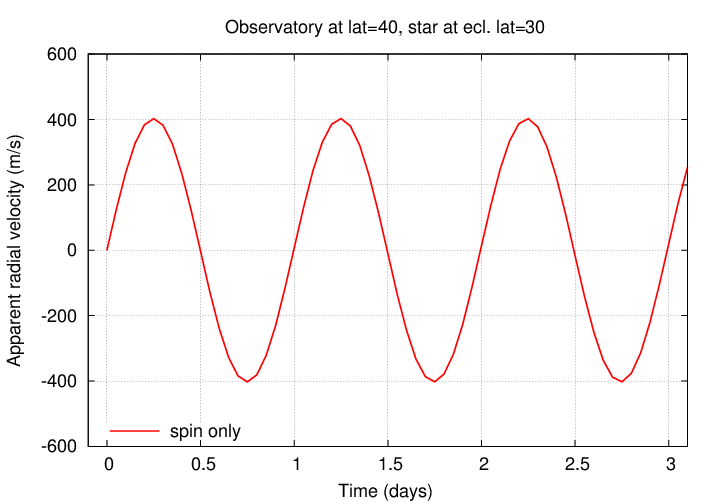
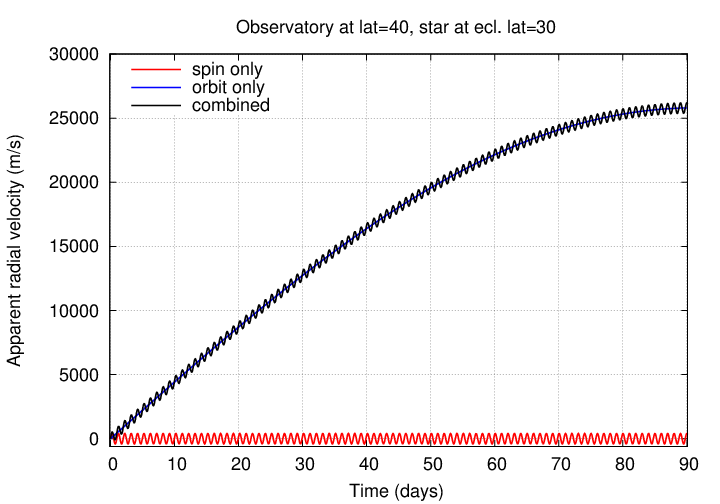
But the effect of the Earth's orbital motion is also important, even over a few days,
... and ESPECIALLY over longer periods:
Okay, you've figured out how to keep your spectrograph stable. You have a good scheme for calibrating the data. You correctly account for the motion of the Earth around the Sun, and your telescope around the axis of the Earth. The signal you deduce consists solely and precisely of the light which was emitted by the star.
That means that every feature you see in the radial velocity must be due to reflex motion, right?
WRONG!
The problem is that stars aren't perfectly quiet sources of light. They have their own sources of variation in intensity and in wavelength which can compete with or even overwhelm changes caused by a planet.
Consider the star we know best: the Sun.
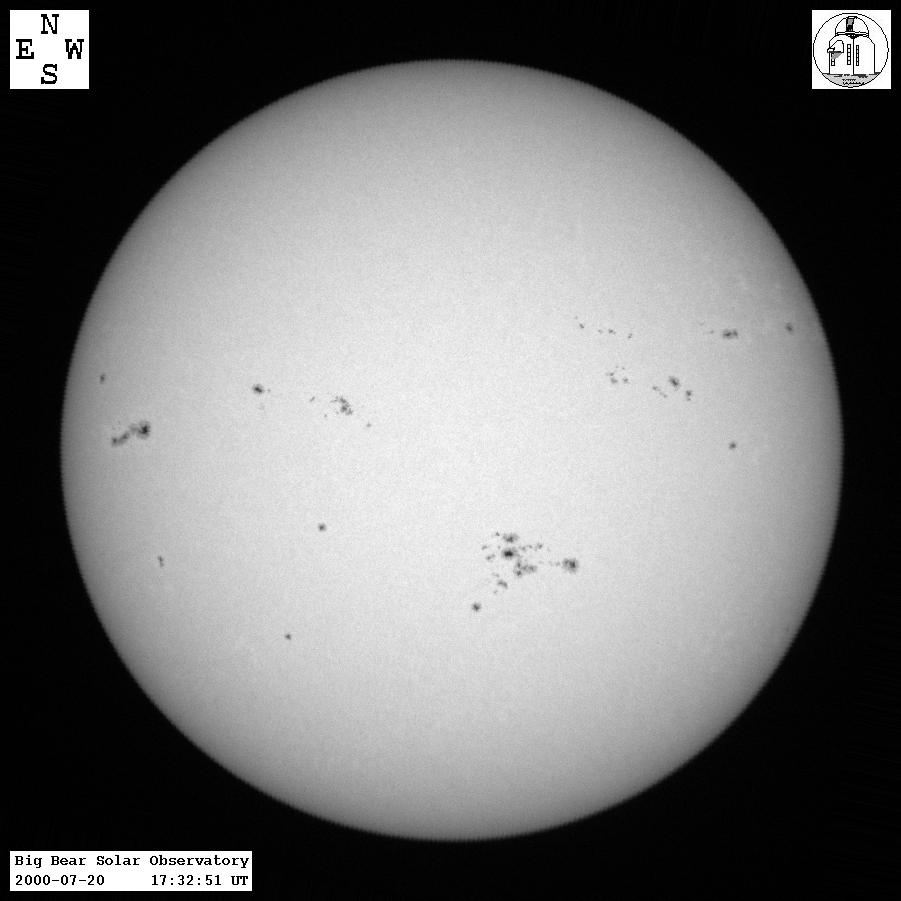
See all those little spots? They are somewhat cooler than the surroundings -- maybe 4000 K rather than 5800 K -- and so they emit less light. What effect will they have on the Sun's radial velocity?
       The radius of the Sun is about 7 x 10⁸ meters.
       Its period of rotation is very roughly 30 days (but depends
       on solar latitude).


       Q:  What is the rotational speed of the gas moving
           around the Sun's equator?


       Q:  What fraction of the Sun's left half (which is coming
           toward us) in the picture above is covered by sunspots?


       Q:  Estimate very roughly how much the overall radial
           velocity of the Sun changes due to these spots.
Let's compare your results to a more sophisticated calculation by a recent study: Korhonen et al. (2015) look at a solar-like star with a spot of radius of about 5 degrees on the solar photosphere. In the figure below, panel "b)" shows the variations in radial velocity of the star, as seen by a distant observer. (Panels "c)" and "d)" show the signal of a Neptune-mass planet in a 25-day orbit, without and with the sunspot).
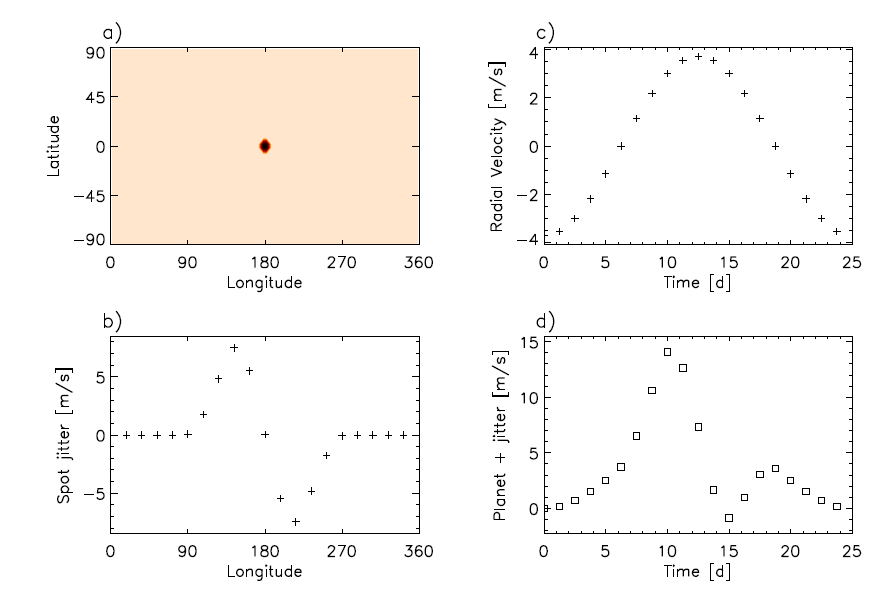
Fig 1 from
Korhonen et al., MNRAS accepted (2015)
The calculation above features just one big spot, which is sort of a worst case scenario. If there are many spots, they might act to cancel each other out. Let's see ....
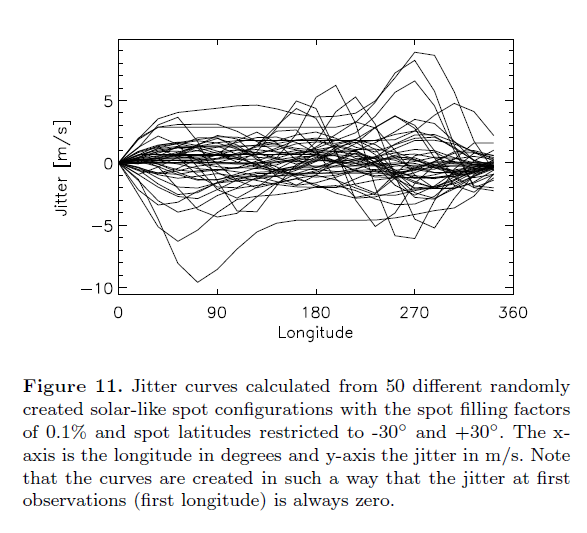
Fig 11 from
Korhonen et al., MNRAS accepted (2015)
Of course, this effect depends on several factors: the rotational speed of the star and the inclination of its rotational axis to the line of sight, in particular. Observing at longer wavelengths (farther into the red and IR) can reduce the jitter, as the contrast in brightness between the spot and its surroundings will be lower.
Solar-type stars may have cycles of stellar activity, during which the number of spots would increase. Clearly, the more activity, the larger the "jitter" in the measured radial velocity.
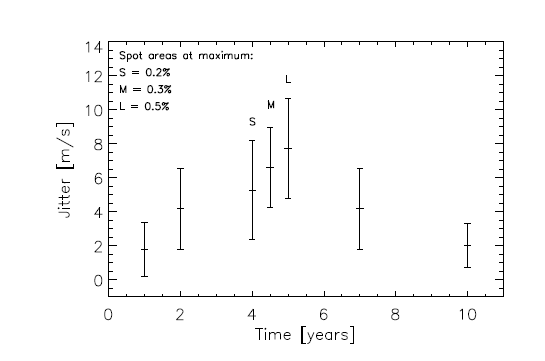
Fig 16 from
Korhonen et al., MNRAS accepted (2015)
Planet hunters must hope that they look for their targets during the right point in a star's cycle.
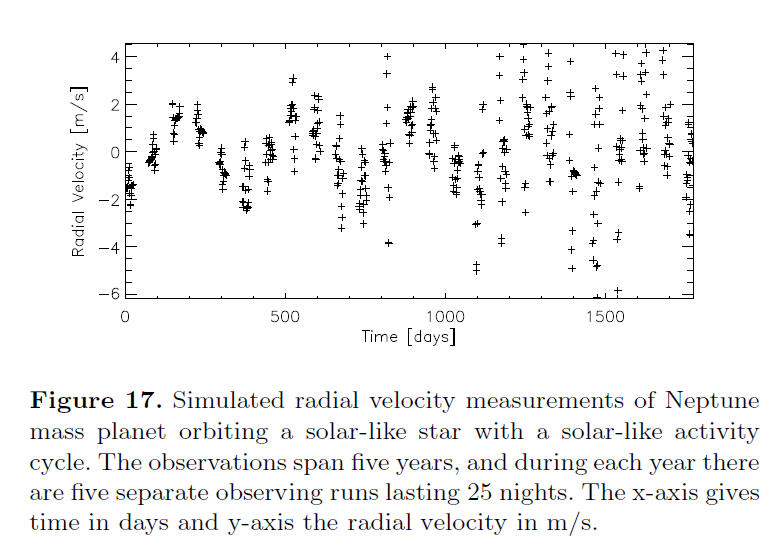
Fig 16 from
Korhonen et al., MNRAS accepted (2015)
Suppose that you've managed to avoid stars with spots and strong stellar activity cycles. Can you be sure that your spectra will yield measurements with a precision of 1 m/s?
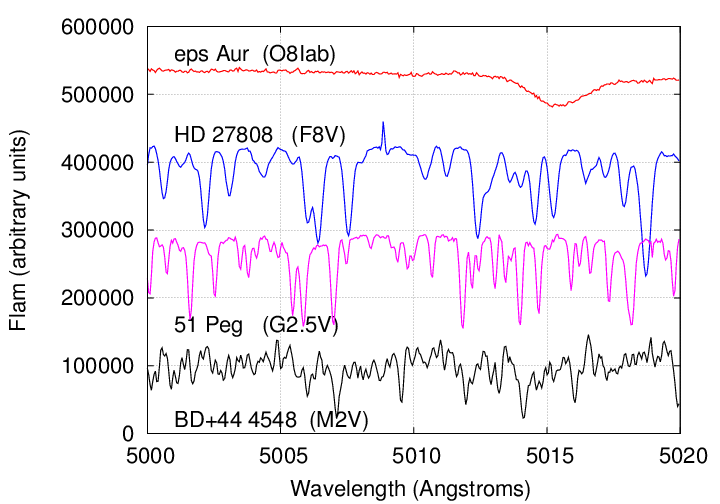
Maybe, maybe not. Consider the following four stars.
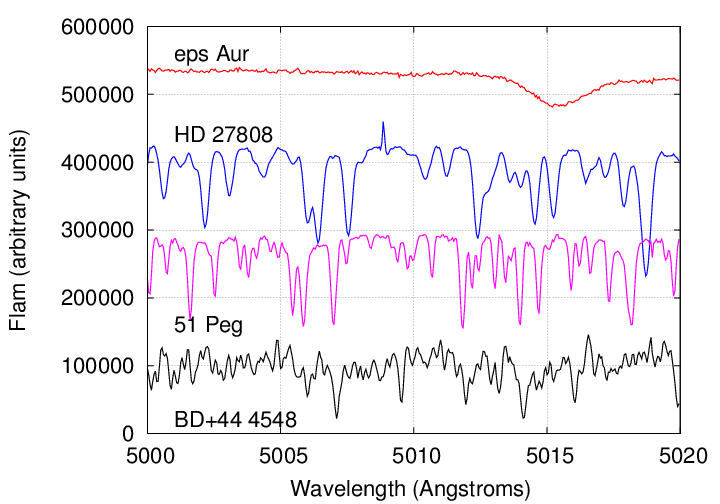
Data courtesy of the
Elodie archive
  Q:  Which of these stars would yield the
      most precise radial velocities?   Why?


  Q:  What's the reason for these differences?
Perhaps these labels will provide a clue.
Data courtesy of the
Elodie archive
Yes, the spectral class of a star -- which depends largely on the temperature of the photosphere, and on the pressure to a lesser degree -- plays a large role in the nature of the absorption lines in a spectrum.
The "best" stars, for an astronomer using an optical spectrograph, are the FGK stars: they tend to have a lot of relatively strong lines. Of course, the examples above show just a teeny-tiny section of the entire optical spectrum, so things might look slightly different toward the blue or red end of the spectrum; but remember that it's often necessary to average together results from thousands of lines in order to achieve the desired precision (around 1 m/s).
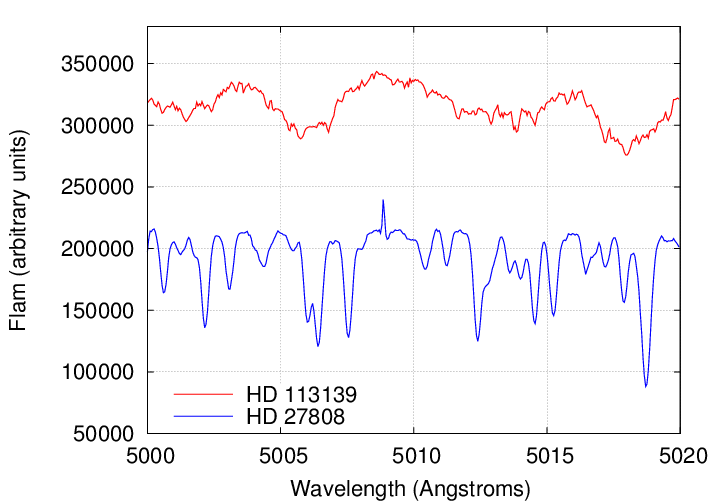
Consider these two spectra, both belonging to main sequence stars of spectral class F:
Data courtesy of the
Elodie archive
  Q:  Which star would yield better radial velocity
      measurements?   Why?
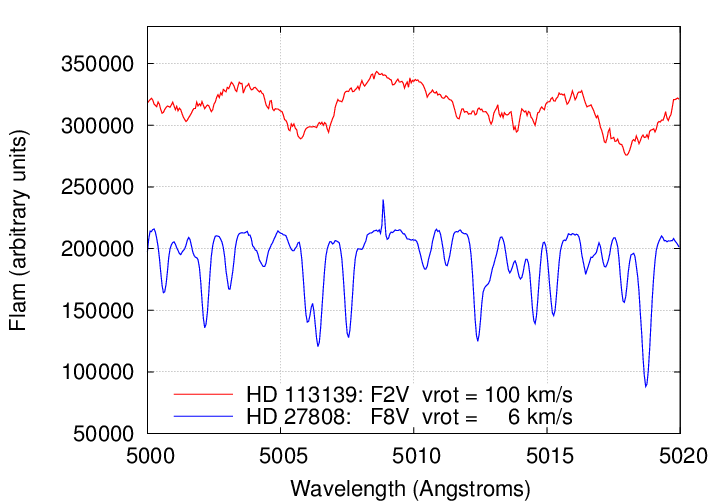
Clearly, HD 27808 would permit better measurements, due to its large number of sharper, deeper absorption lines. But if these are both type "F" stars, why the difference?
Q: Why is HD 27808 so much better than HD 113139?
Maybe this will help:
Data courtesy of the
Elodie archive
Even if you manage to conquer the many challenges posed by the Stupid Earth and Stupid Stars, you still face one big problem: the radial velocity method can only place a lower limit on the mass of an unseen planet. The reason is the effect of the inclination of a planetary (and stellar) orbit.
For example, consider two stellar systems in which identical stars of 1 solar mass are circled at a distance of 1 AU by big planets. The blue system contains a planet of 1 Jupiter mass, while the red system has a planet of 2 Jupiter masses.
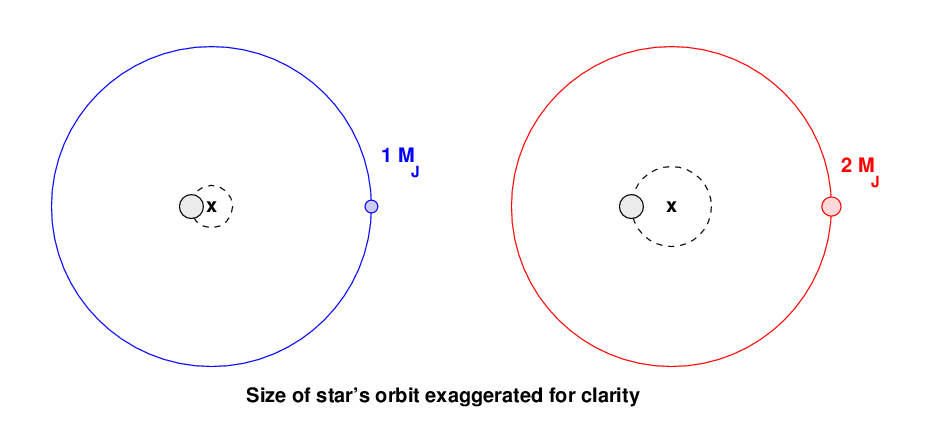
In the figure above, I have GREATLY exaggerated the size of the star's orbit around the center of mass, just so that you can see it clearly. If I drew it properly, it would be less than 1 pixel in diameter at this scale.
And, of course, I have also GREATLY exaggerated the sizes of the stars and planet relative to their orbits. It's just about impossible to use accurate graphics due to practical reasons when talking about space ....
Now, the period of the planet in each system is (almost) exactly the same: 1 year. That means that the star in each system also has a period of 1 year around the center of mass. But because the star in the red is twice as far from the center of mass, it must travel twice as far during that 1 year period; and that means that it has double the speed of the star in the blue system.
If we observed both systems in the same orientation, edge-on, then we would measure radial velocities something like this:
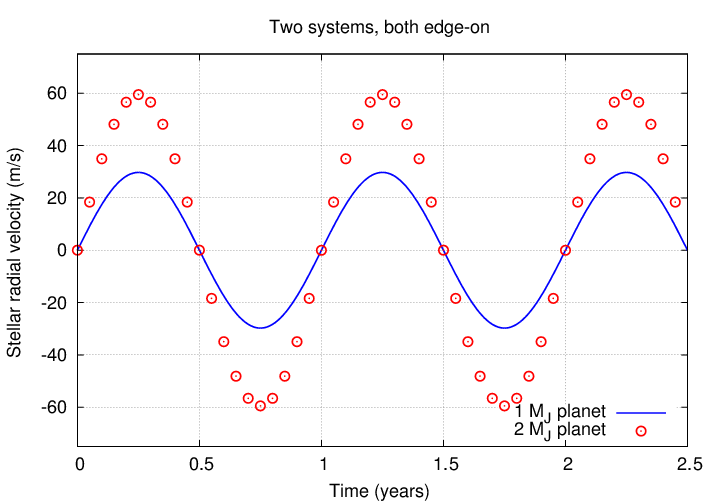
In this case, it's clear that the red system must have a planet with greater mass.
But what if the blue system is observed edge-on, but the red system happens to be tilted by 60 degrees from edge-on?
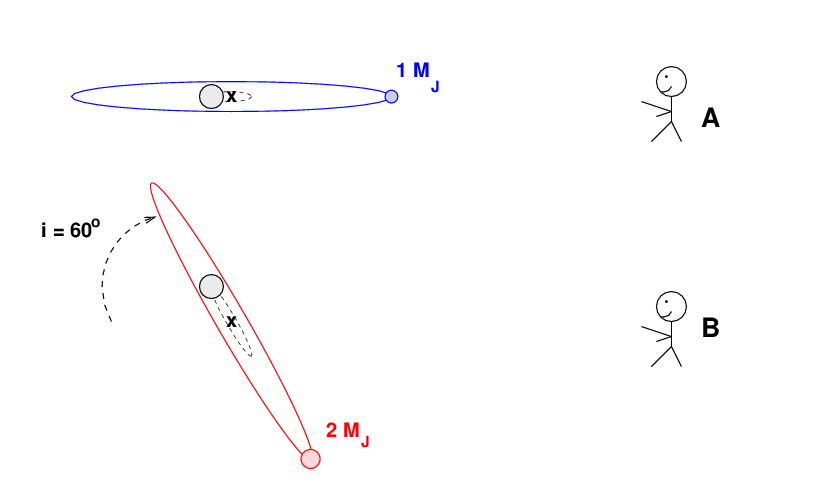
In this case, the star in the red system is still travelling a greater distance, and moving with a faster speed -- but the PROJECTION of that distance, and speed, along the line of sight to the observer is now one-half of its true value; and that projected distance is now the same as the distance travelled by the star in the blue system.
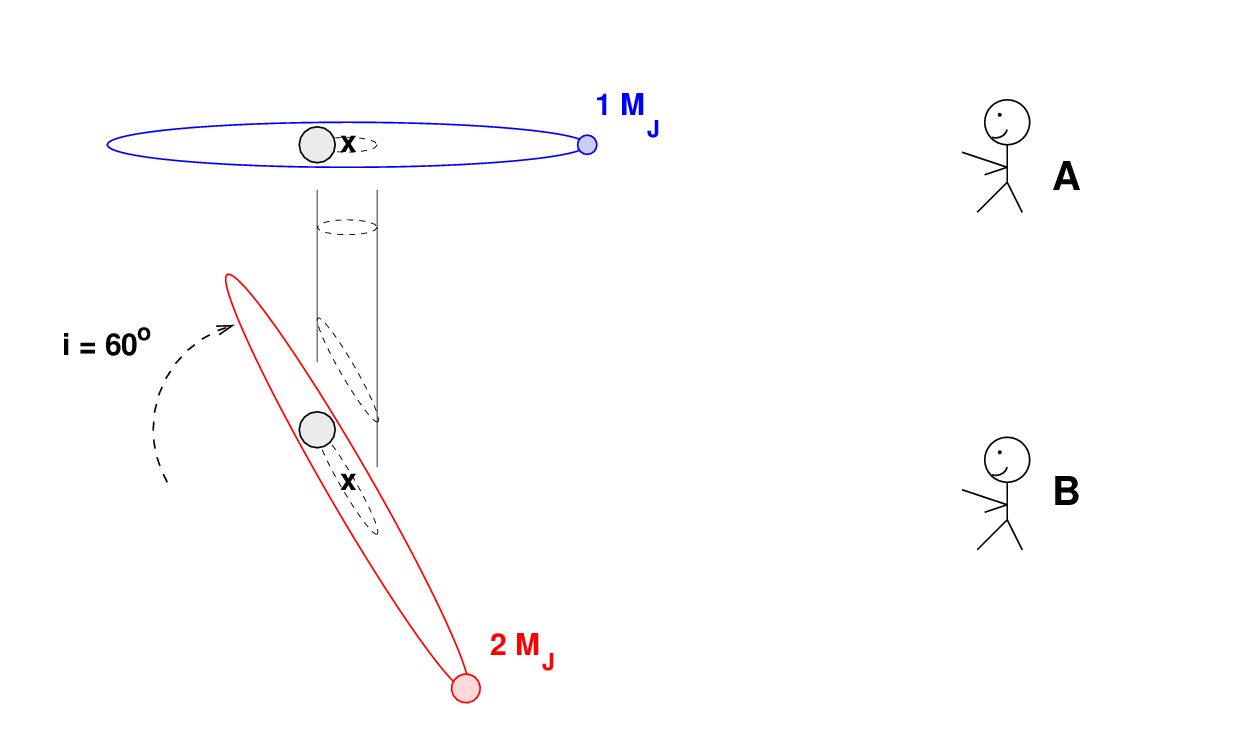
If the observers measure the radial velocity of the host stars in these two systems, they will find identical amplitudes:
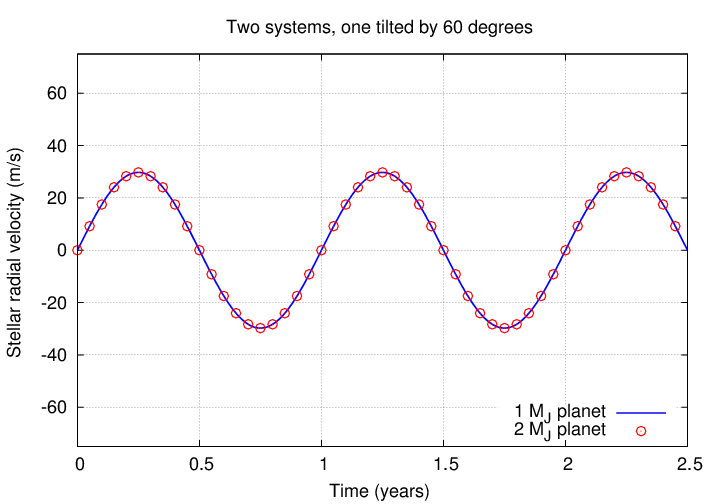
This is the problem with radial velocity measurements. They give us information on only one component of the host star's motion, and so any planetary mass derived from radial velocity (alone) will suffer from ambiguity:

Turning raw spectra into clean spectra requires a lot of work with special reduction software. I can't talk about that here.
Calibrating spectra and measuring the positions of lines and calculating the radial velocity for a single spectrum is really complicated, too. You'll have to check out the technical literature for help with that.
But, once you have a series of radial velocity measurements, like this:
      #  JD            velocity_(m/s)
      2454602.85804     -187.65
      2454603.10267     -198.11
      2454603.86302     -142.90
it's not so hard. There are plenty of tools which have been written to analyze periodic signals (yeah, yeah, big surprise, right?). You can find a nice list of tools which are specially designed with astronomers in mind by looking at
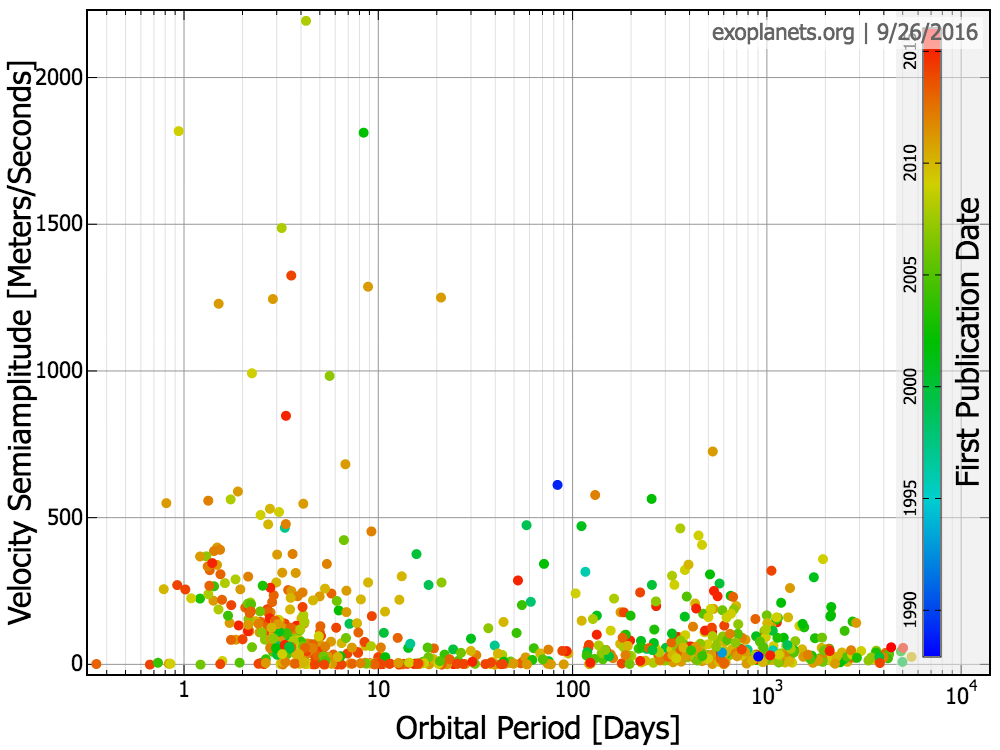
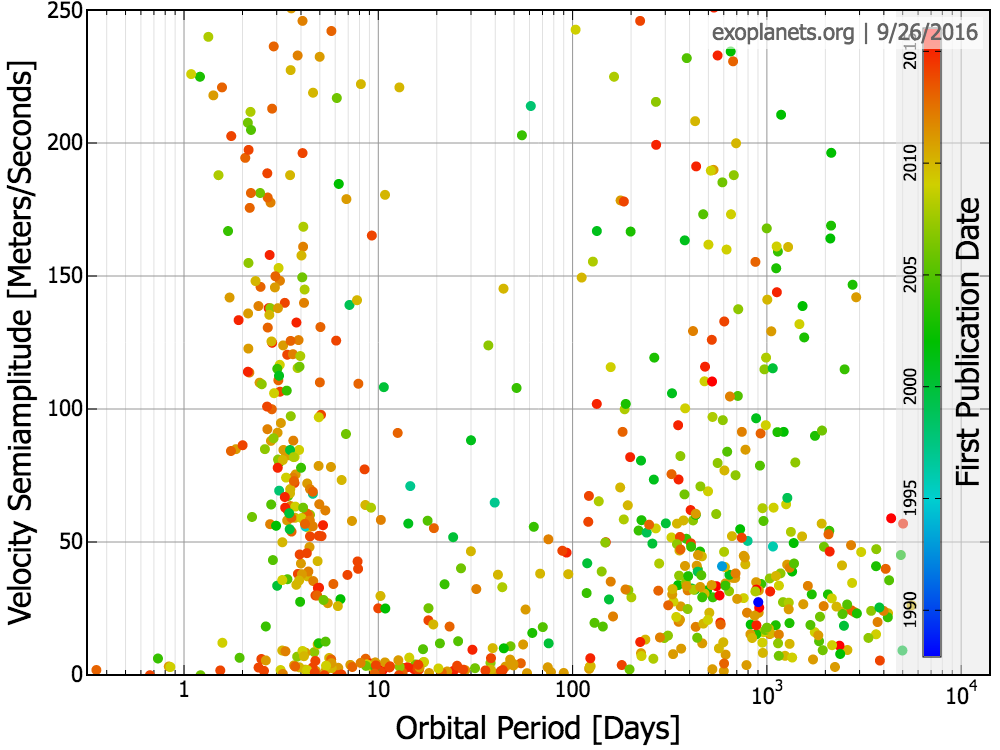
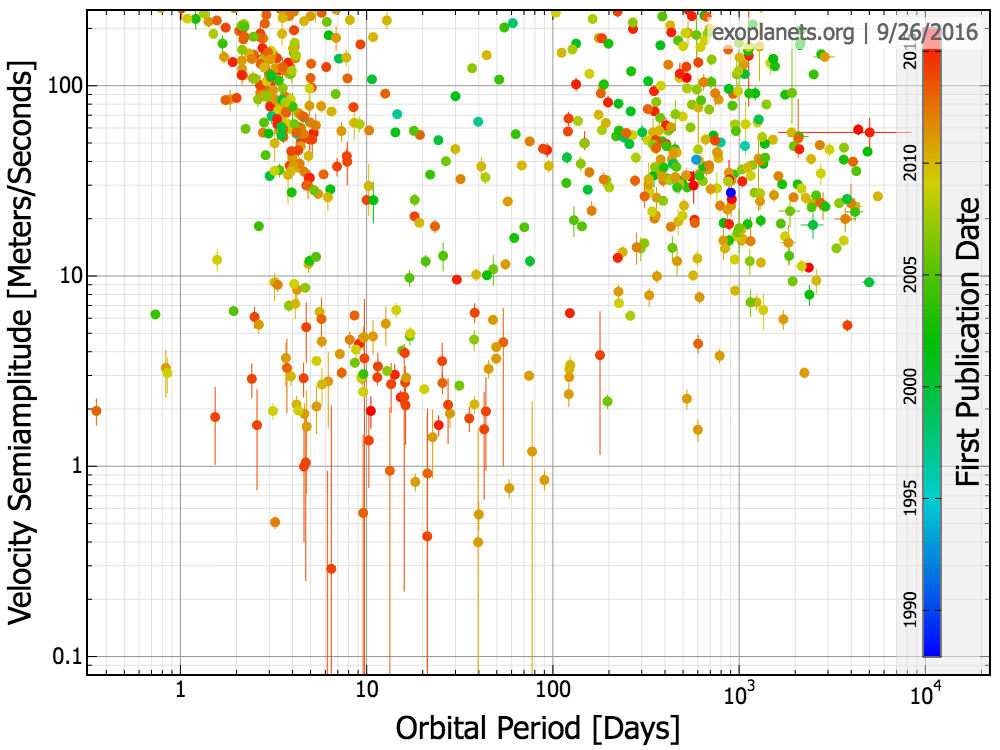
Where would you find the following planets in this diagram?
 Copyright © Michael Richmond.
This work is licensed under a Creative Commons License.