 Copyright © Michael Richmond.
This work is licensed under a Creative Commons License.
There are a number of phenomena in astronomy which give rise to periodic signals:
If you suspect that your target is varying in a regular way, how can you find its period? Today, I'll give some general background on the analysis of a periodic signal, and then explain in detail one of the many different methods for finding the period: the string-length technique.
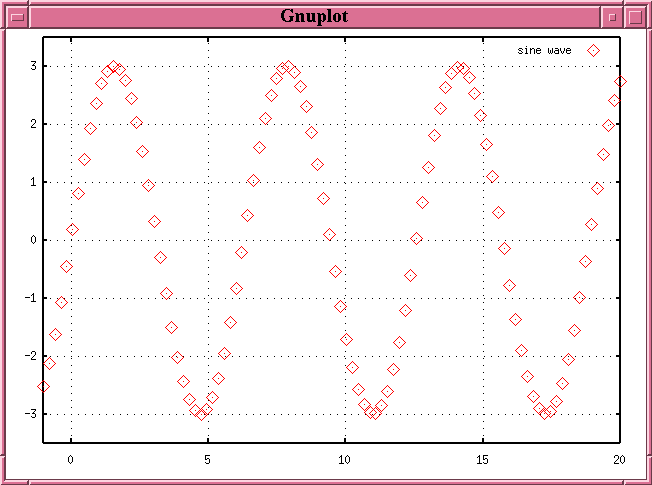
Consider a very simple periodic signal:

A sine wave described by
y = 3 * sin( x )
We can describe this signal with two parameters:
If we have a very long stretch of data, and we plot the signal versus time, we end up with a very long graph:
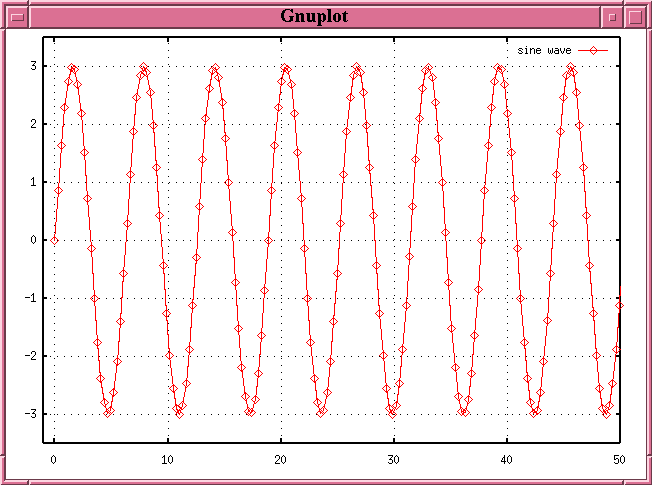
It is possible to squish a very long stretch of data onto a small graph if one converts the time variable to a related quantity: phase. Phase is defined as the fractional portion of the number of periods which have elapsed at a given time:
                                                            t
          phase at time t  =  fractional portion of  (  ---------  )
                                                          period


                                    t                    t
                           =    --------  -   int (  ---------- )
                                 period                period
The phase ranges over a fixed, small range: from 0.0 (start of a period) to 1.0 (end of a period). If we take that same sine curve as before, with data running from time t=0 to t=50, and this time plot its value versus phase, we get a very simple graph:
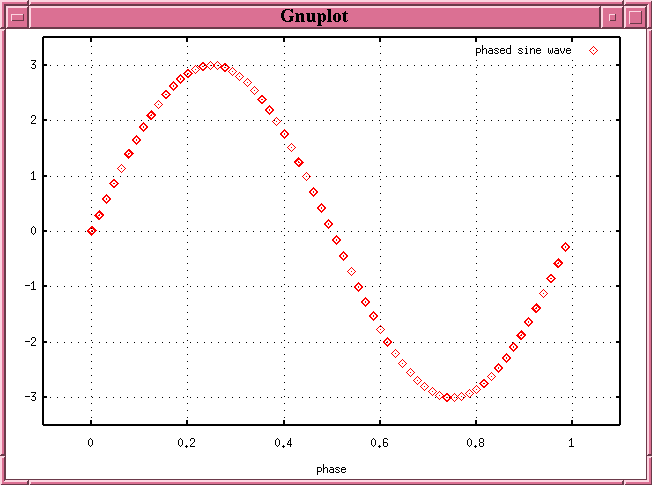
This has nice features:
As you will see below, we can use phase diagrams to figure out the period of an unknown signal.
What happens if we try to calculate the phase of a signal, but do so with the wrong period? Once again, we'll use a simple sine curve to illustrate. But this time, we'll calculate the phase with a period slightly different from the true value. When we plot the points in a phase diagram, we see this:
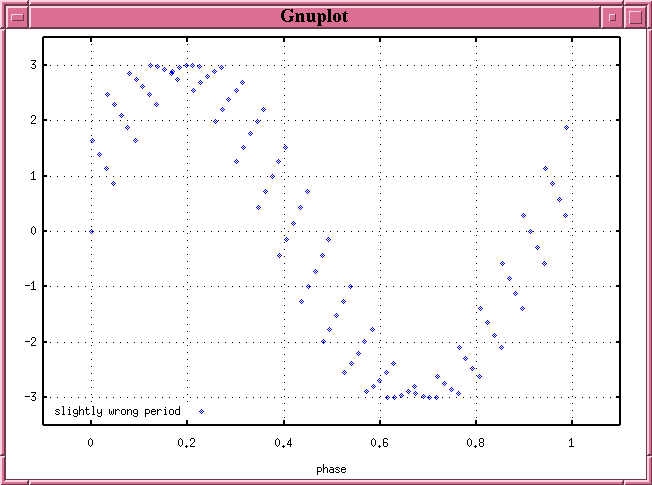
Hey! The phased data no longer lie along a single, smooth locus in the diagram. Instead, they form a wide band. This is a signal that the period used to calculate the phase was incorrect.
If we use a period which is far from the true value, the phased data scatter all over the diagram:
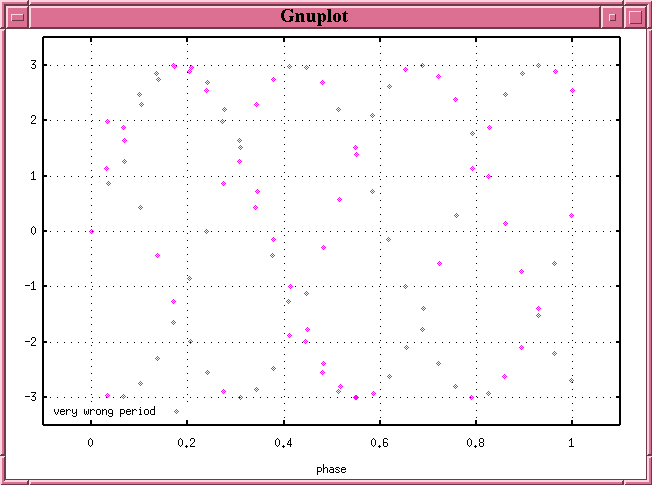
Only if the proper period is used to calculate the phase will the data fall along a single, narrow path in the phase diagram. We can use this fact to determine the period: pick a period, calculate the phase, and plot the resulting phase diagram. Modify the period and repeat until the points fall along a narrow locus.
The method ought to work, but it sounds pretty subjective; is there any way to make it quantitative? Yes! The string-length method provides a numeric metric for assessing the "narrowness" of the locus of points in a phase diagram. A good reference is the paper A period-finding method for sparse randomly spaced observations of 'How long is a piece of string?' by Mike Dworetsky, MNRAS, 203, 917 (1983); you can find it on-line at
    http://adsabs.harvard.edu/cgi-bin/nph-bib_query?
        bibcode=1983MNRAS.203..917D&db_key=AST&high=3c321cbf8321100
The idea is simple:
LOOP:
The period which yields the smallest sum of lengths ("shortest piece of string") is the best estimate of the true period.
Give it a try! Here are some measurements of a variable star on several nights during the course of week:
   Time (truncated Julian Date)          Magnitude
   ----------------------------         -----------
          12.46                           8.417
          12.55                           8.500
          12.64                           8.835
          12.73                           9.167
          12.79                           9.261
          13.45                           9.267
          13.54                           9.078
          13.63                           8.707
          13.69                           8.499
          15.52                           8.836
          15.61                           8.503
          15.70                           8.415
          15.79                           8.632
          17.68                           8.530
          17.77                           8.880
A light curve of the star looks like this:
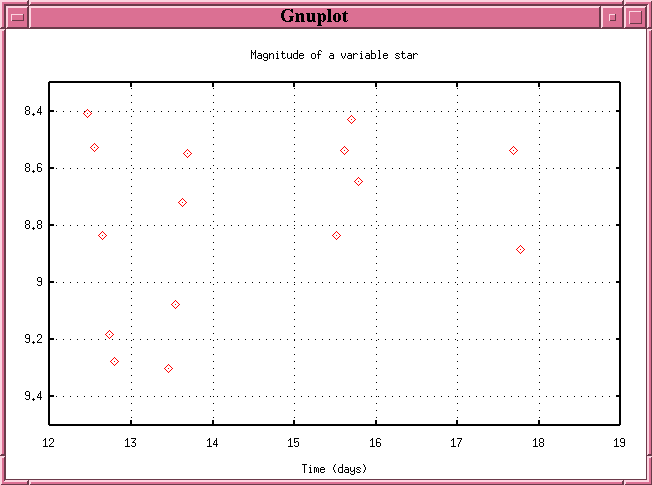
Make a guess at a reasonable range for the period -- it's some fraction of a day. Then, divide the interval into a number of pieces, and for each candidate period, make a phase diagram and calculate the string length. It takes time ... but one can easily program a computer to perform the calculations.
Jeff Robertson of Indiana University gave a very nice list of references for period-finding techniques in an E-mail to VSNET (vsnet-chat 131), which I reproduce below:
-----------------

An old but nice introduction and review to the four or five most popular period
finding methods can be found in [1] by Fullerton. This includes the various
"string-length" methods made popular by Lafler and Kinman [2]. This method has
been expanded upon by Stellingwerf [3] with the PDM method which is now a part
of IRAF. Most of the people I am associated with use FFT methods as prescibed
by Horne and Baliunas [4] and can now be found in the Numerical Recipes [5]
book. There is also a DFT method [6] which I am not to familiar with.

I am also interested in anyone else's methods and ideas...

References:
1. The Study of Variable Stars Using Small Telescopes, Fullerton, A.W. 1986,
   ed. J.R. Percy, Cambridge University Press, p 201-218.

2. An RR Lyrae Survey With The Lick 20-inch Astrograph II. The Calculation
   An RR Lyrae Survey With The Lick 20-inch Astrograph II. The Calculation
   of RR Lyrae Periods By Electronic Computer, Lafler, J. and Kinman, T.D.
    ApJS 11, p 216-222.

3. Period Determination Using Phase Dispersion Minimization (PDM),
   Stellingwerf, R.F. 1978,  ApJ 224, 953-960.

4. A Prescription for Period Analysis of Unevenly Sampled Time Series,
   Horne, J. and Baliunas, S. 1986,  ApJ 302, 757-763.

5. Search Algorithm For Weak Periodic Signals In Unevenly Spaced Time-Series,
   Press, W.H. and Teukolsky, S.A., Numerical Recipes, Cambridge Univ. Press.

6. Time Series Analysis with Clean - Part One - Derivation of a Spectrum,
   Roberts, D. H., Lehar, J., Dreher, J. W.,
   1987,  AJ, 93, 968.

   which is illustrated in practice here ...

   Discovery of a possible X-ray triple - 4U 1915-05,
   Grindlay, J. E., Bailyn, C. D., Cohn, H., Lugger, P. M., Thorstensen, J. R.,
   Wegner, G., 1988,  ApJ, 34L, 25
 -------------------
You can find a set of programs to do the job in various ways at the VSNET "Tools and Programs" site:
http://vsnet.kusastro.kyoto-u.ac.jp/vsnet/etc/prog.html
One of the best tools is the "AVE" program written by the Grup d'Estudis Astronomics in Spain.
 Copyright © Michael Richmond.
This work is licensed under a Creative Commons License.