 Copyright © Michael Richmond.
This work is licensed under a Creative Commons License.
At this point, you should have completed
in processing the images of asteroid 1107 Lictoria. The goal for today is to put together all the measurements and see if we can detect any significant variation in its brightness as a function of time.
The first thing to do is to combine all the raw measurements into a single big table, something like this:
    Julian Date       asteroid      star B      star C
----------------------------------------------------------
     361.5147          -8.38        -14.22       -9.07
     361.5149          -8.24        -14.20       -9.14
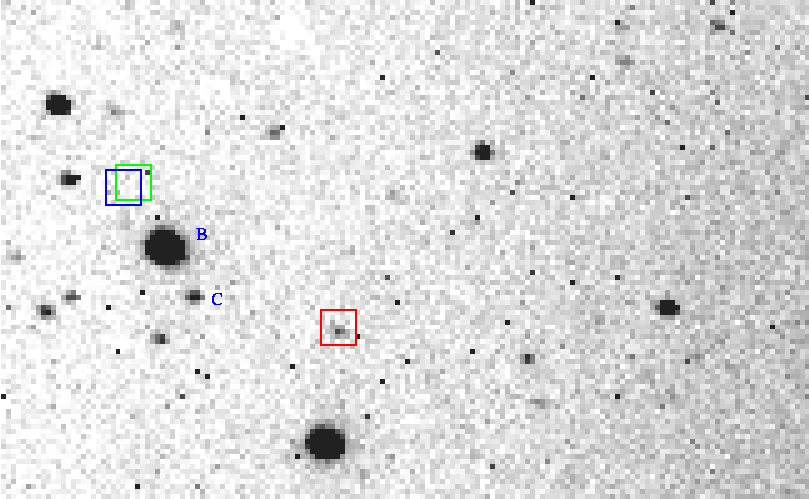
Notice that the bright star's measurements are much more steady than those of the faint star. Why? In every case, you have measured (signal from star - background). The background level is not exactly constant: there are small variations from pixel to pixel. In the image below, for example, you can see that the counts of all the pixels within the blue background box would be slightly different than the counts of all the pixels within the green background box ...

For bright stars, such as B, the signal is so much larger than the background that tiny variations in the exact placement of the aperture boxes don't matter: the signal dominates the sum within the aperture.
But for faint stars, like star C or the one in the red box above, the counts from the star are comparable to the variations in the sky background. The difference between the background measured in one place, and the background measured in a slightly different place, can yield a signficantly different result for (counts from star - background).
Exercises:
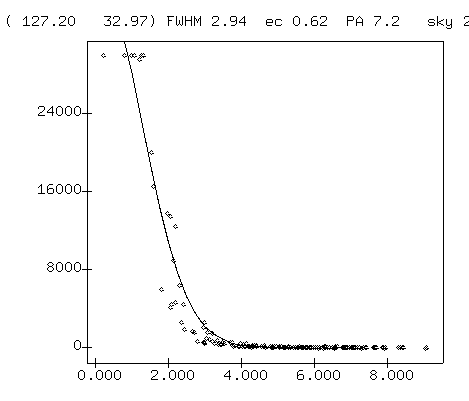
- Look closely at the radial profile for star B shown on the left above. Discuss the pixel values near the center of star B. Is there any reason to distrust them?
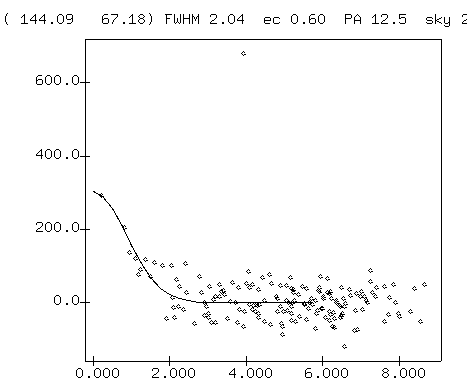
- Discuss the pixel values show in the radial profile of the faint star, shown on the right above. Why is one datum shown far above all the others?
To make a light curve, one plots the magnitude of an object against time. In other words, one plots magnitude on the Y-axis and time on the X-axis. It is conventional to arrange the graph so that bright objects are shown near the top and faint ones near the bottom -- in other words, so that the magnitude values increase downwards.
Exercises:
- Make a light curve which shows the magnitudes of the asteroid, star B and star C, using all the measurements made by the class.
When you look at the light curve of several objects in the same field, you sometimes see variations which affect all the objects roughly equally and simultaneously. Here's an example, from CCD images taken with a Mark IV CCD camera in Batavia, IL, on Nov 27, 2001. First, the raw data files: each of the plain ASCII text files below has 9 columns of data. The important ones are
data in image taken at JD = 223.8024
data in image taken at JD = 223.8043
data in image taken at JD = 223.8060
data in image taken at JD = 223.8078
Now, here's a graph showing the raw, instrumental magnitudes for the first four stars in each data file as a function of time.
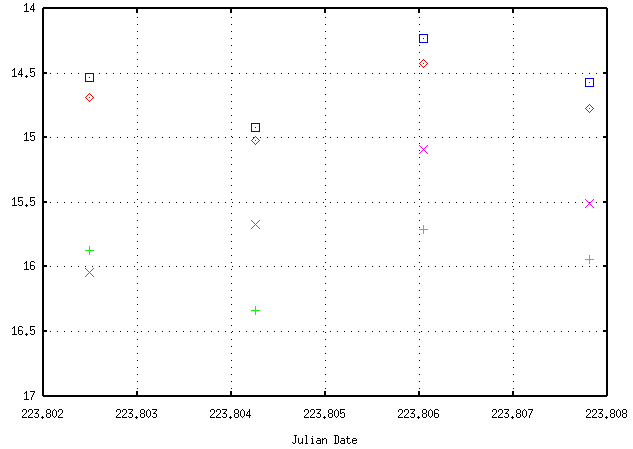
These lockstep variations can be caused by clouds passing in front of the telescope: all stars fade as the clouds arrive, then brighten when the clouds leave. Look at the background sky levels measured for these images:
     223.802      3160 counts per pixel
     223.804      3520 counts per pixel
     223.806      2400 counts per pixel
     223.807      3250 counts per pixel
Exercise:
- Are the sky levels and instrumental magnitudes correlated or anticorrelated? Explain the relationship you see.
In order to remove these variations which are common to all stars, we can transform instrumental magnitudes into differential magnitudes.
differential mag of star X = mag X - mag A
Remember, magnitudes are logarithmic quantities. When we calculate the difference of two magnitudes, we are comparing the ratio of two brightnesses. It is much easier -- not just in astronomy, but in almost any experimental science -- to measure ratios than it is to measure absolute values.
Below is a graph showing the differential magnitudes of the the same set of 4 stars from the Mark IV data, relative to the brightest star.
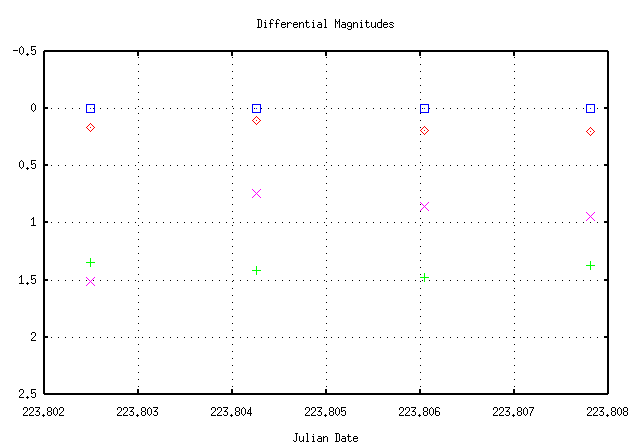
You can see now that three of the stars have nearly the same differential magnitude in all images, but one of them is clearly changing relative to the others.
Exercise:
- Compare the y-axis in the original graph to the graph of differential magnitudes. Explain the difference.
It is almost always a good idea to calculate differential magnitudes when looking at light curves. Clouds aren't the only factor which can cause instrumental magnitudes to vary together. If the telescope drifts out of focus due to temperature changes, or turbulence in the atmosphere blurs stellar images by different amounts at different times, instrumental magnitudes will show similar lockstep variations.
Moreover, once you have calculated differential magnitudes for stars in a field in several different images, you can easily determine the uncertainty in the measured magnitudes.
                       [  sum  (mag - mean_mag)^2   ]
        stdev  =  sqrt [  ------------------------  ]
                       [           N - 1            ]
The standard deviation from the mean differential magnitude is often used to describe the quality of a set of measurements. Bright stars will have small stdevs, and faint stars large ones.
In fact, one can learn quite a lot about the quality of a set of photometric measurements by making a plot of (standard deviation from the mean differential magnitude) versus (mean differential magnitude). Using the Mark IV data set above, we find:
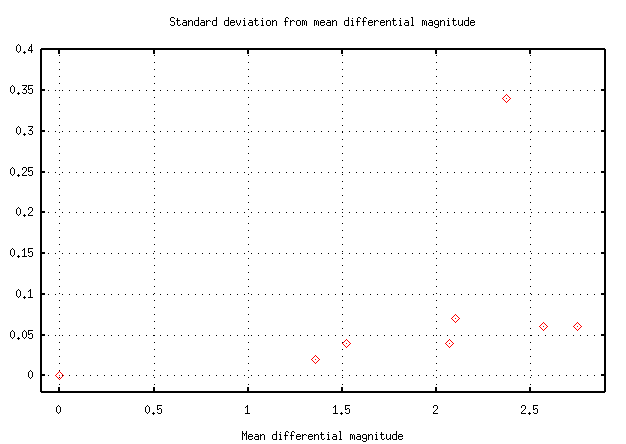
The standard deviation from the mean rises for faint stars. You can simply look at the graph to estimate the uncertainty in a single measurement of a star of any particular differential magnitude.
Exercise:
- One of the points in the graph above lies far above the others. Why? Give several possibilities.
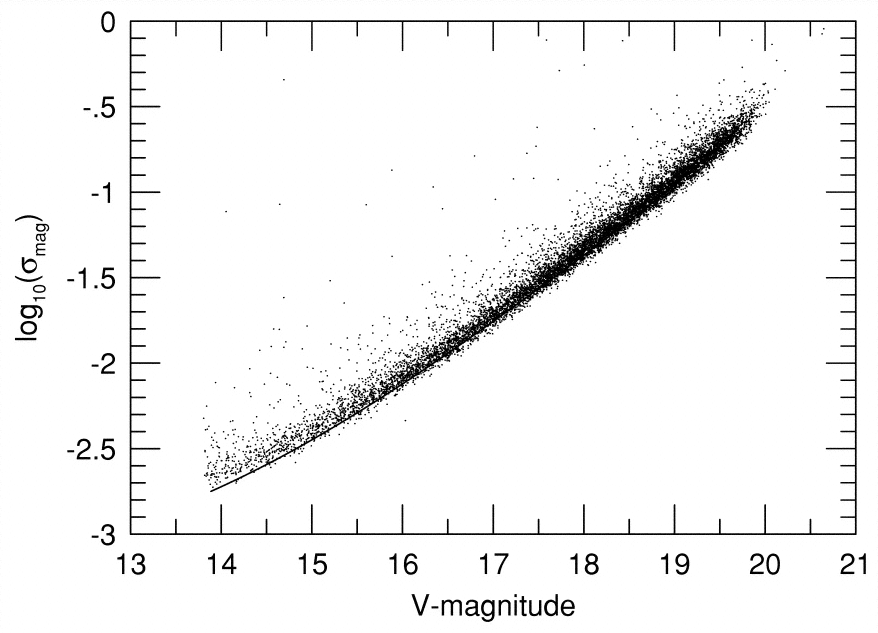
Here's a similar graph showing the precision one can reach with CCD photometry if one works very hard. It comes from the paper "A Technique for Ultrahigh-Precision CCD Photometry", by Mark Everett and Steve Howell, PASP 113, 1428 (2001). Note the logarithmic scale on the Y-axis!
Exercise:
- If we were to reduce another set of images of Lictoria, what should we do differently? Make a list.
 Copyright © Michael Richmond.
This work is licensed under a Creative Commons License.