
 Copyright © Michael Richmond.
This work is licensed under a Creative Commons License.
The point of this experiment is to show you that the resistance of an object can change with temperature. That's not unusual -- most basic properties of materials change with temperature. But the real point is to show you how scientists can describe such a change mathematically ... and how they often choose to make linear approximations.
Suppose that some metal -- say, copper -- has a resistance which changes in a very simple manner as temperature changes:
resistance(T) = resistance(To) + A * (T - To)
If this were true, then the coefficient A would give the absolute change in resistance for a given change in temperature:
                      resistance(T) - resistance(To)
             A    =   -------------------------------
	                          T  -  To
And, if you were to plot resistance versus temperature, the slope of the graph would always be A, no matter what temperature you choose as the reference To.
Question 1: What would the units of this coefficient be?
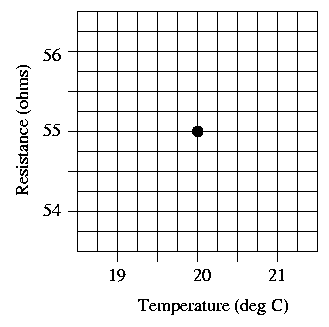
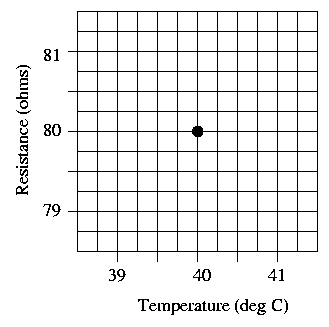
The graphs below show close-ups of the behavior of resistance as a function of temperature, near reference temperatures of To = 20 and To = 40 Celsius. Suppose that for copper, the value of A is exactly 1.0. Draw marks at the resistance values one degree above and below the reference temperature on each graph, and use them to draw a line on each graph showing resistance as a function of temperature.
Question 2: Are the slopes of the two graphs the same?


Now, if real copper behaved according to the above equation, with a coefficient of A = 1.0, then for any copper object, increasing the temperature by 1 degree Celsius would force the resistance to increase by 1 ohm. That would have to be true for all of these very different objects:
Question 3: Assuming the above relationship to be true, calculate the resistance of each of the 4 objects at T = 21 degrees.
Question 4: Does that make any sense?
 Copyright © Michael Richmond.
This work is licensed under a Creative Commons License.