 Copyright © Michael Richmond.
This work is licensed under a Creative Commons License.
Copyright © Michael Richmond.
This work is licensed under a Creative Commons License.
Before today's class, you were asked to read this paper by Edwin Hubble:
A relation beween distance and radial velocity among extra-galactic nebulae (PNAS, 15, 168 (1929)
Let's first discuss that paper. We'll then move on to the material listed below.
Back in the 1920s, an astronomer in California named Edwin Hubble was in the right place at the right time. The hot topic in astronomy was "galaxies" -- what were they, and how far away were they? Just a few years earlier, the astronomical community was split on the question "Are galaxies clouds of gas and stars within our own Milky Way, or are they independent structures, outside the Milky Way and equally large?" Scientists were coming to a consensus that they were outside the Milky Way, and perhaps just as big -- but they didn't have any good measurements of distance, so they couldn't be sure.
Hubble realized that he had the resources to answer these questions. He worked at the Carnegie Institute in southern California, which had two of the most powerful telescopes in the world at that time:
He could also collaborate with Milton Humason, who specialized in making the very difficult spectroscopic measurements of faint objects such as galaxies.
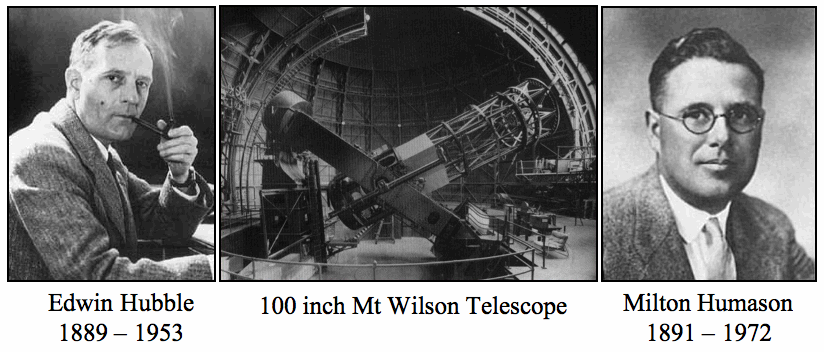
Hubble started a long-term program to study galaxies with these instruments, with the goal of measuring two quantities in particular:
This was no easy task.
How did Hubble determine the distances to galaxies? As described in Hubble and Humason, ApJ 74, 43 (1931) , he used Cepheid variable stars when possible, since he recognized that they were the best of the available distance indicators; but he could measure their properties only in members of the Local Group, such as M31 and M33. For more distant galaxies, Hubble was forced to rely on indicators which he fully recognized were less accurate:
We know now that some of the objects which Hubble considered isolated stars were unresolved blends of star clusters or HII regions. Thus, many of his measurements of distances were underestimates, since he assigned the combined light of many stars to that of a single star. In other words, he might assign a distance of 2 Mpc to a galaxy that was really 10 Mpc away from us.
Now, as for the second part of the required dataset -- radial velocities -- Hubble relied in large part on the work done by Milton Humason, who rose from the position of mule driver and janitor to become one of the best observational astronomers of his day. Many of the crucial spectra were taken with the 100-inch (2.5 meter) telescope at Mount Wilson. As an example, consider the spectrum of NGC 7619. Humason took two photographs:

Taken from
Humason, Contributions from the Mount Wilson Observatory, 3, 21 (1928)
  Q:  If a typical night is 8 hours long, how can one expose a photographic
           plate for 33 or 45 hours?
Based on the two spectra, Humason estimated the velocity of NGC 7619 to be 3828 and 3754 km/s; he found a weighted average of 3779 +/- 100 km/s.
Below are samples of other spectra taken by Humason with the 100-inch telescope and similar equipment.
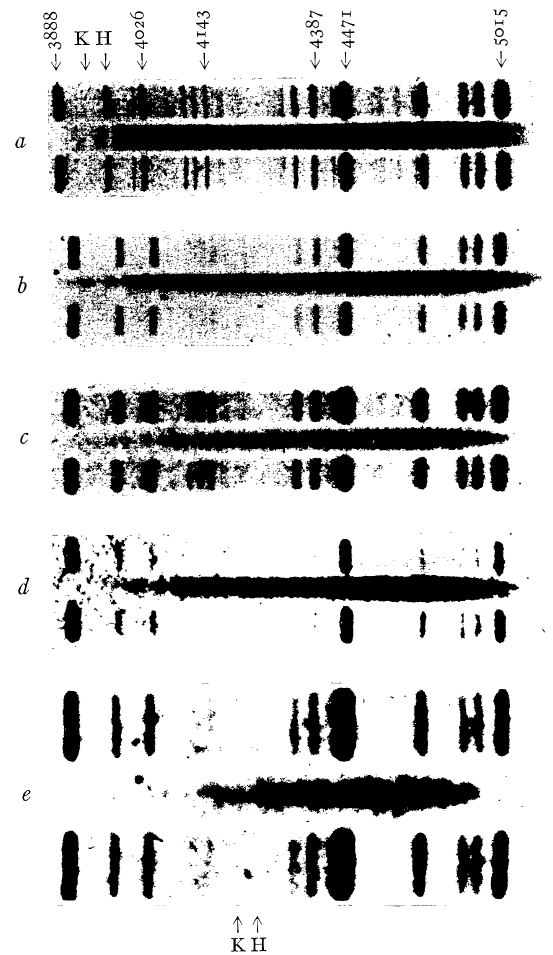
Figure taken from
Humason, ApJ 74, 35 (1931)
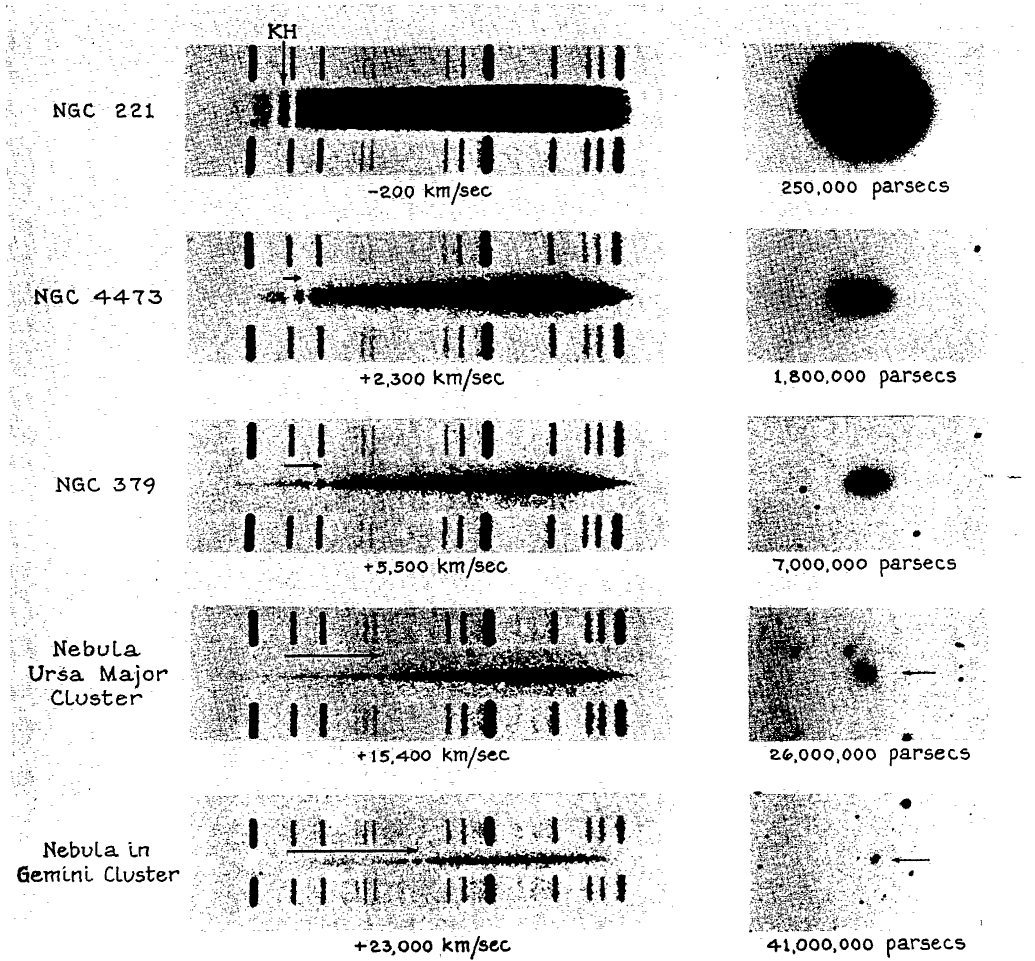
Figure taken from
Humason, ApJ 83, 10 (1936)
Astronomers in recent years have also measured the velocity of NGC 7619. For example, Wegner et al., AJ 126, 2268 (2003) used a telescope of similar size, the MDM 2.4 m at Kitt Peak, to acquire a spectrum with roughly the same dispersion, about 140 Angstroms per mm. However, the modern spectrum
Rather than ask you to try to make measurements from copies of the photographic spectra that Humason collected in the 1920s,
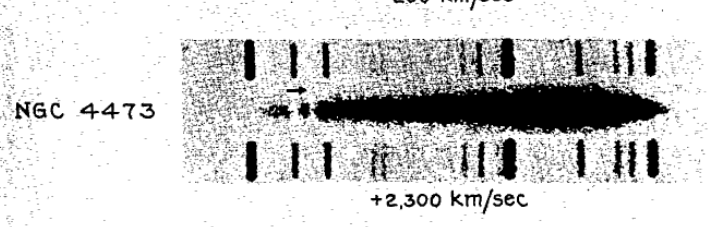
Spectrum taken from
Humason, ApJ 74, 35 (1931)
I'll give you a more modern spectrum. Below is the spectrum of a galaxy taken by the Sloan Digital Sky Survey (SDSS). This project used a telescope roughly the same size as Humason and Hubble did, but with much more sensitive modern detectors.
Note that we will focus on the same features that Humason and Hubble did: two strong absorption lines in the blue part of the spectrum, near the wavelength 400 nm.
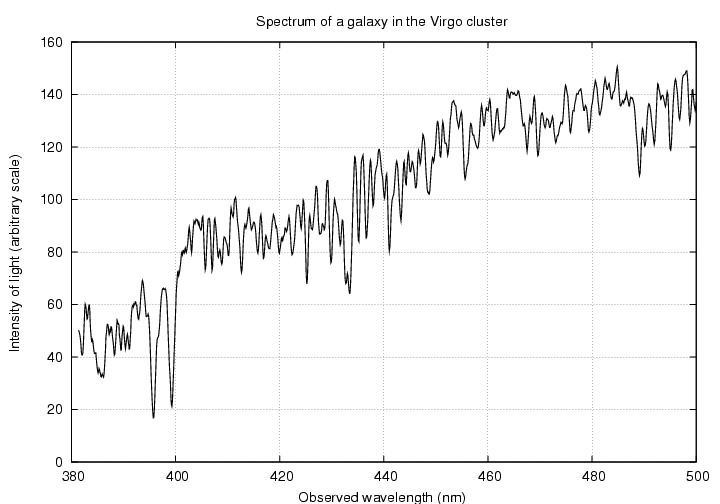
   Q: What are the observed wavelengths of the two strong
         absorption lines just to the left of 400 nm?
These two absorption lines are due to calcium atoms in the atmosphere of stars in this galaxy. When we make measurements of calcium atoms in laboratories here on Earth, we find the following wavelengths:
   Calcium "K" line:      393.3  nm

   Calcium "H" line:      396.8  nm
You should notice that the wavelengths you measured in the galaxy's spectrum are LONGER than these rest wavelengths. The reason is that the galaxy -- and all the stars in it -- is moving away from Earth. We can use a version of the Doppler shift formula to use the size of the shift in wavelength to estimate the speed of this galaxy away from us.
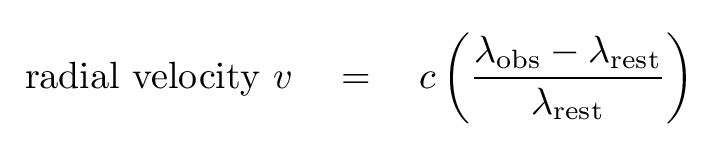
So, give it a try: use the original Hubble diagram (published in 1929) to measure the relationship between velocity and distance. Measure the slope on the graph, and use it to compute the Hubble constant. Warning: the units on the y-axis aren't labelled properly. They should be "km/sec", not just "km."
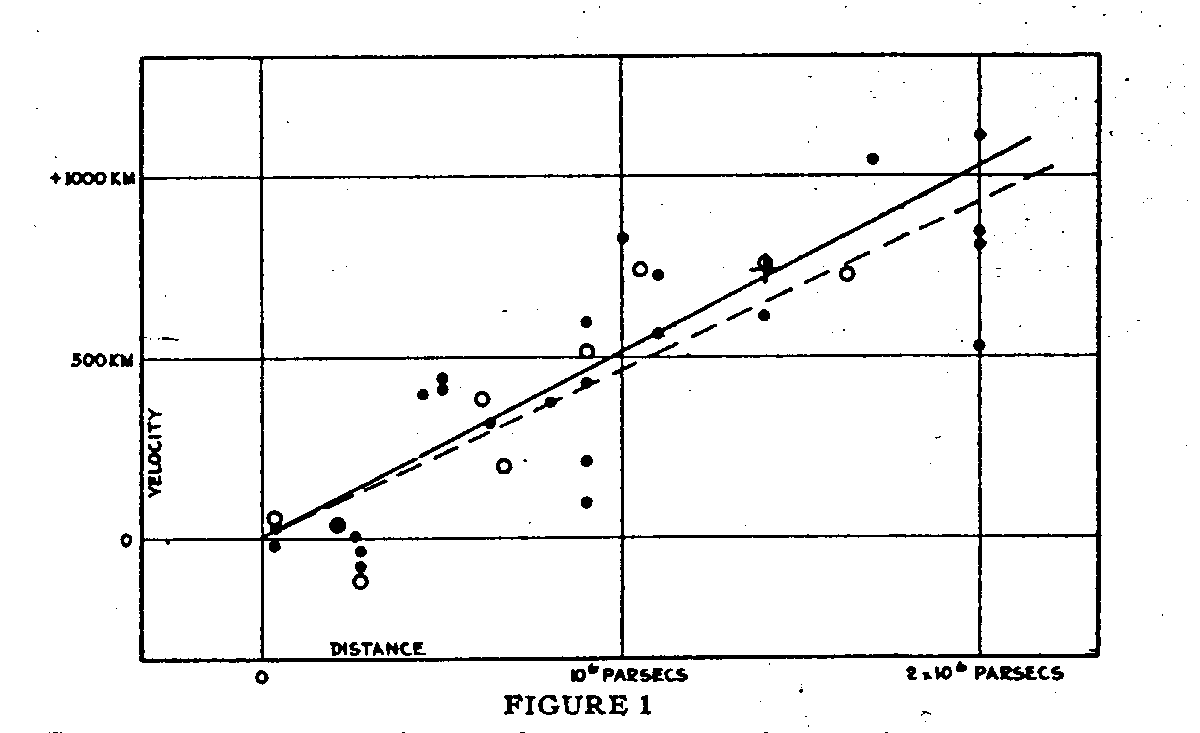
Figure taken from
Hubble, PNAS 15, 168 (1929)
  Q:  What is the value of the slope on this graph?  Convert your
            answer to have units of (km/sec) per Mpc.
We now rely on other means to measure distances to nearby galaxies: in addition to Cepheids -- which we can detect in much more distant galaxies than Hubble could -- we use SBF, PNLF, TRGB, GCLF. Below is a graph showing the distances measured using Cepheid variable stars (Ferrarese et al., ApJS 128, 431 (2000)) to a set of galaxies which is similar to that used by Hubble. The velocities are very similar, but the distances are not.
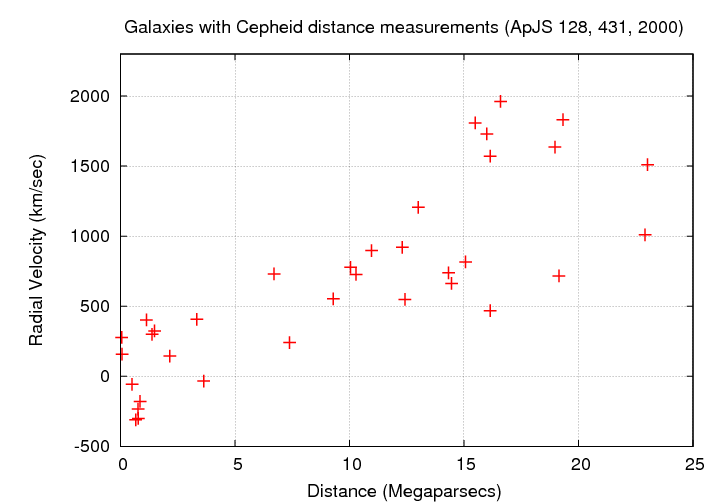
Graph based on data from
Ferrarese et al., ApJS 128, 431 (2000)
  Q:  What is the value of the slope on this graph?  Convert your
            answer to have units of (km/sec) per Mpc.


  Q:  How does this value compare to the one based on Hubble's data?
Copyright © Michael Richmond.
This work is licensed under a Creative Commons License.