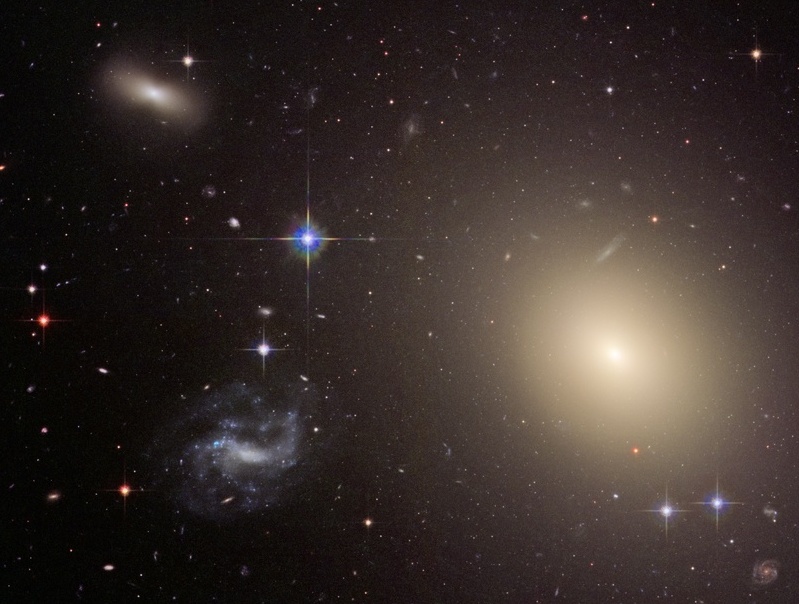
In the image below, the central galaxy NGC 5982 is an elliptical, flanked above (NGC 5981) and below (NGC 5985) by spirals.
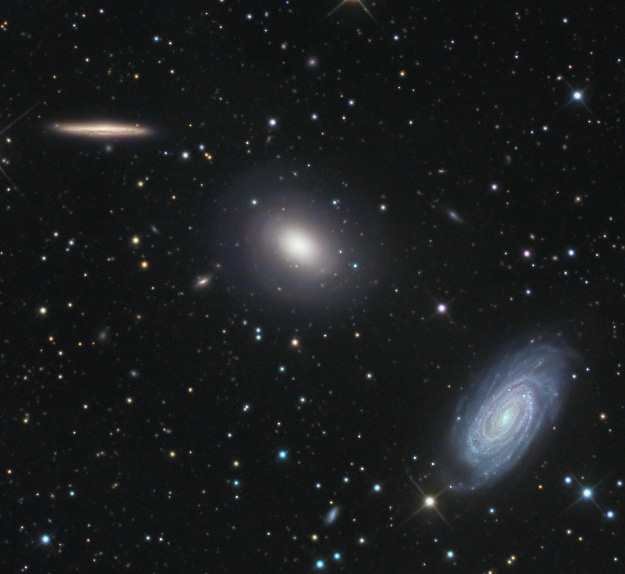
Image by Giovanni Benintende ,
thanks to
Astronomy Picture of the Day.
In his book The Realm of the Nebulae, Edwin Hubble organized galaxies into a sequence which splits spirals into normal and barred families, yielding the familiar "tuning fork diagram".

Image courtesy of
The Las Cumbres Observatory
The criteria used to place galaxies on this diagram are
- ratio of major to minor axis (for ellipticals)
- ratio of bulge to disk (for spirals)
- tightness of the winding of spiral arms
- strength and length of individual arm segments
Ellipticals are given a designation of the letter "E" plus a digit, where the digit represents the ellipticity of the galaxy's outer isophote, multiplied by 10. In the equation below, a is the diameter of the galaxy's major axis, and b the diameter of the minor axis.

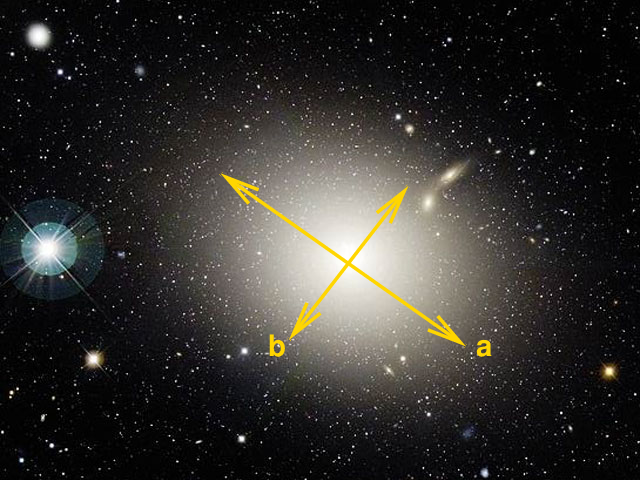
Image of M87 courtesy of (and modified from)
Canada-France-Hawaii Telescope, J.-C. Cuillandre (CFHT), Coelum
The designations given to spiral galaxies are less easy to quantify; they rely on visual inspection of the galaxy and a long experience of classifying galaxies. The general idea is to assign a letter between a and d to each spiral galaxy, with Sa meaning "large bulge, tightly wound continuous arms"
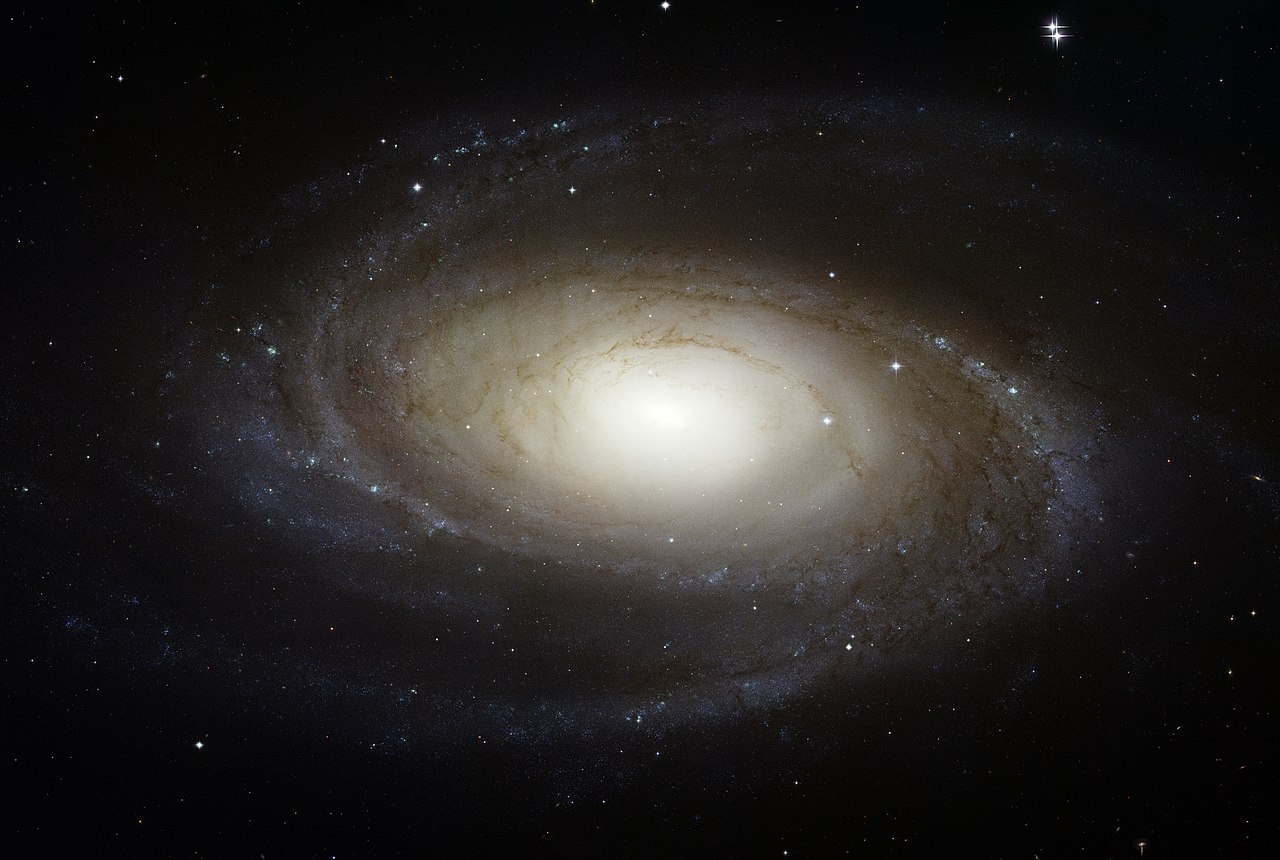
Image of M81 courtesy of
NASA, ESA, and The Hubble Heritage Team (STScI /AURA)
and "Sc" or "Sd" meaning "small bulge, loosely wound flocculent arms".
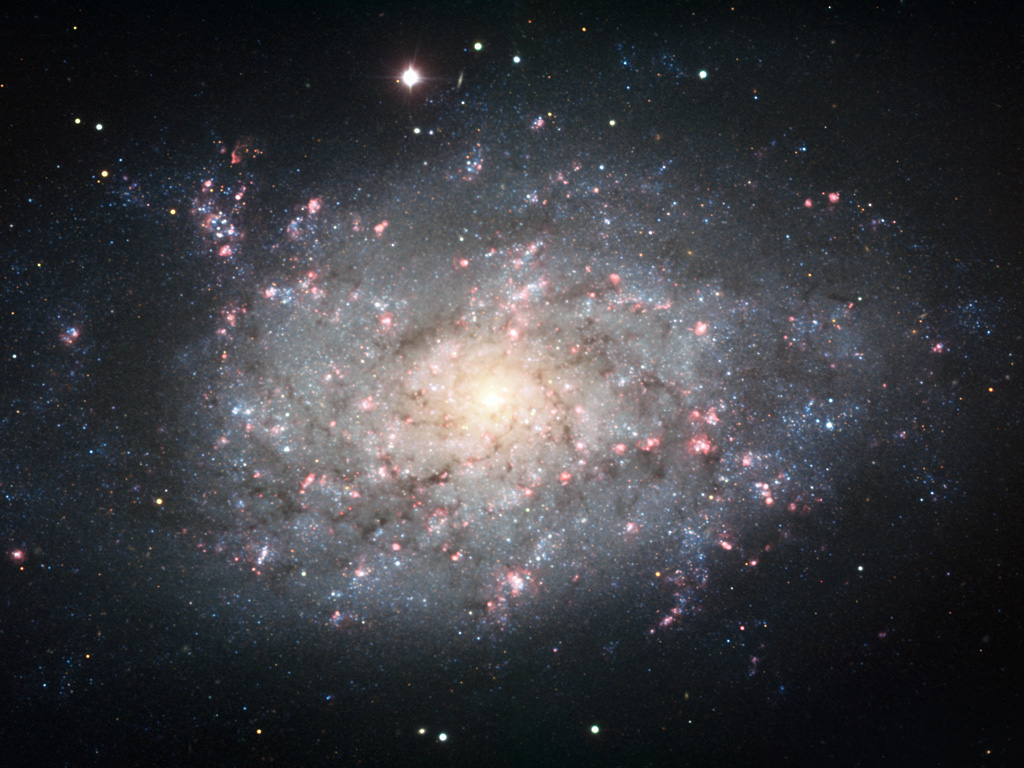
Image of NGC 7793 courtesy of
ESO
Perhaps the best explanation of the procedure can be found in The Hubble Atlas of Galaxies (see pages 7 - 26).
The simple schematic "tuning fork" diagram shown above suggests that the difference between, say, an SBb and SBc galaxy should be easy to see. In real life, galaxies tend to be messy, as the diagram below indicates; it shows real images of galaxies.
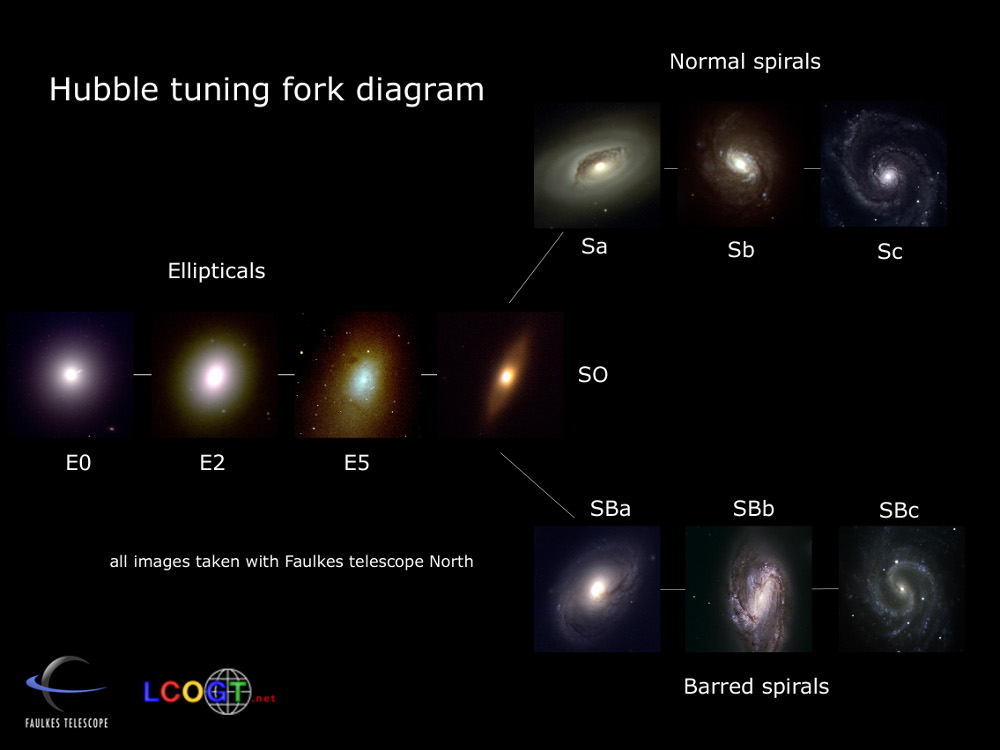
Image courtesy of
Los Cumbres Observatory.
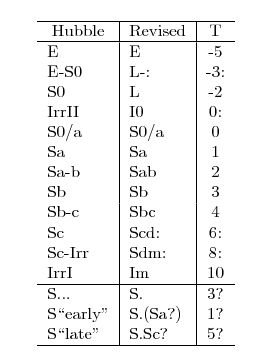
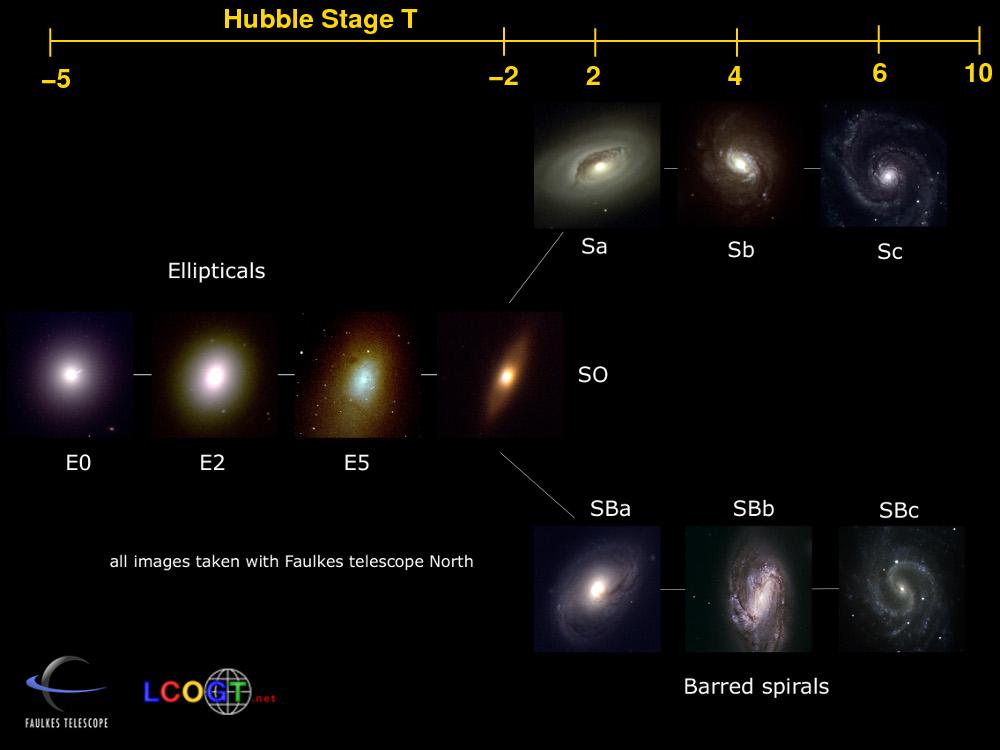
In 1981, the Second Reference Catalog of Bright Galaxies (RC2) by deVaucouleurs et al. provided a means to put all galaxies onto a semi-quantitative scale. The "Hubble Stage" parameter T is an integer value ranging from -5 (for ellipticals) to +10 (for irregulars).
when applied to stars
-
Around the turn of the twentieth century,
astronomers were intensely interested in stellar spectra.
Thanks to the work of the group at Harvard College Observatory
on the Henry Draper project,
there were thousands of examples of good spectra of many
types of stars.
A rough sequence of types was constructed, and arranged
in what was known to be an order by temperature.
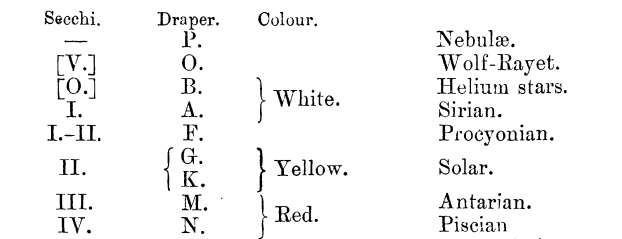
Taken from
The Observatory, vol 38, p 379 (1915).
Some scientists believed that this same sequence, from hot to cold, described the evolution of individual stars over time. In this way, the term "early" came to be applied to the hot O and B stars, and "late" to the cool K and M stars.
By the nineteen-twenties, this view had fallen out of favor, due to increases in the understanding of stellar structure. Nonetheless, the words "early" and "late" continued to be applied to stars following the earlier convention. This annoyed some people
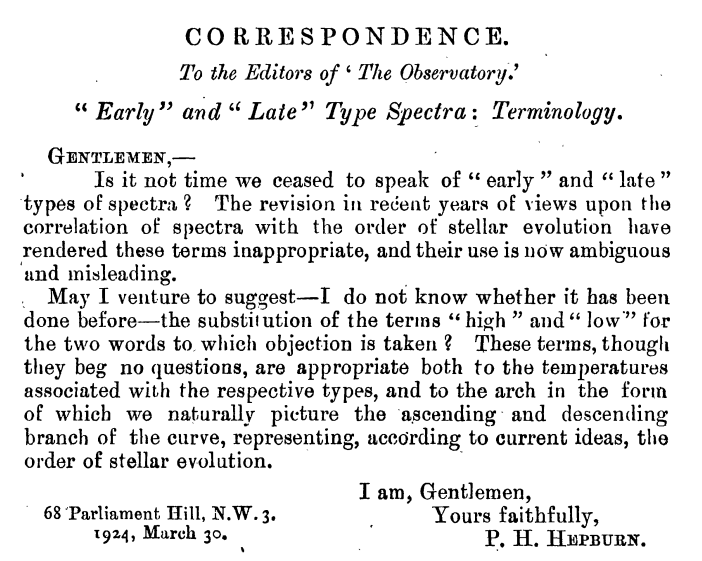
but failed to sway the IAU, as this correspondence shows.
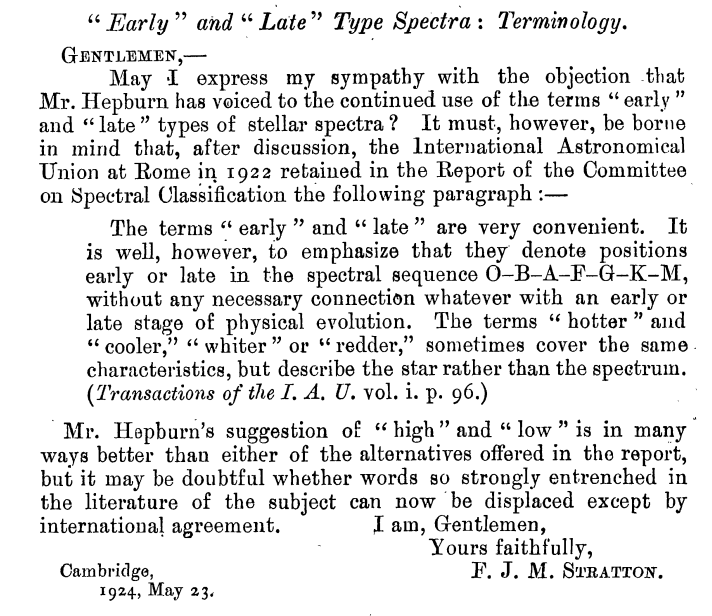
when applied to galaxies
-
Hubble's approach to classifying galaxies was very influential.
His description, in both The Realm of the Nebulae
and in an earlier paper
ApJ 64, 321 (1926)
applies the terms "early" and "late"
to galaxies depending on their position in the tuning-fork diagram.
As this quotation from The Realm of the Nebula shows,
he claimed that these words made no connection to an evolutionary
sequence, while at the same time admitting that they did.
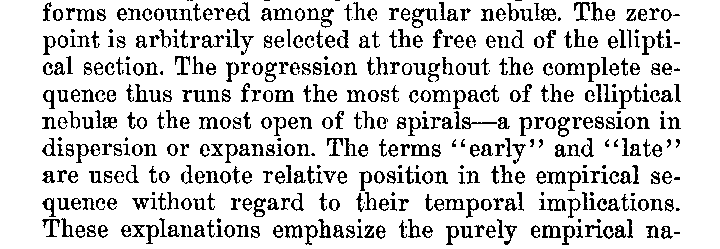

As a result, the terms "early" and "late" have stuck to galaxies, with the sense that "early-type" galaxies are centrally concentrated and redder, while "late-type" galaxies are more diffuse and bluer.
Note the internal inconsistency: early-type galaxies are dominated by late-type stars, and late-type galaxies by early-type stars. Sigh.
- be independent of a galaxy's distance
- not rely on any special isophote or angular size
- not depend on the instrument used or seeing conditions
One choice for a numerical measure of concentration is based on ratios of the radii which contain specific fractions of the total light of a galaxy. Let us define
- r1 as the radius which contains 1/4 of the entire light of the galaxy
- r2 = re as the radius which contains 2/4 = 1/2 of the entire light of the galaxy; this is also called the "effective radius"
- r3 as the radius which contains 3/4 of the entire light of the galaxy
Now, these values will certainly change if we move a particular galaxy closer to or farther from the Earth; but the ratios of these quantities might not. One can use the concentration indices
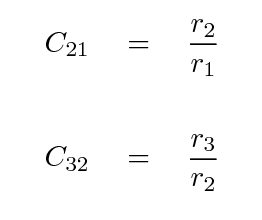
to describe the degree to which light in a galaxy is collected near the center. Large ratios means that the light is highly concentrated, while small ratios mean that the light is diffuse.
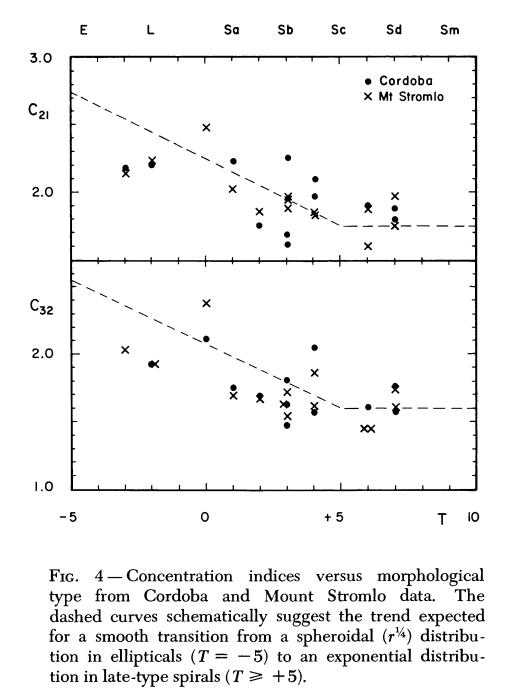
Early work showed hints that high concentrations were found among elliptical galaxies, and lower concentrations among spirals, but the evidence wasn't all that persuasive. This figure comes from an article in 1973.
More recent work (published in 2001) based on digital images shows that the correlation between the concentration of light and morphology really is pretty good. Alas, this particular paper -- and much of the recent work -- adopts a new definition of "concentration index" which is roughly the inverse of the previous one, so in the figure below, small values of C mean the light is highly concentrated.
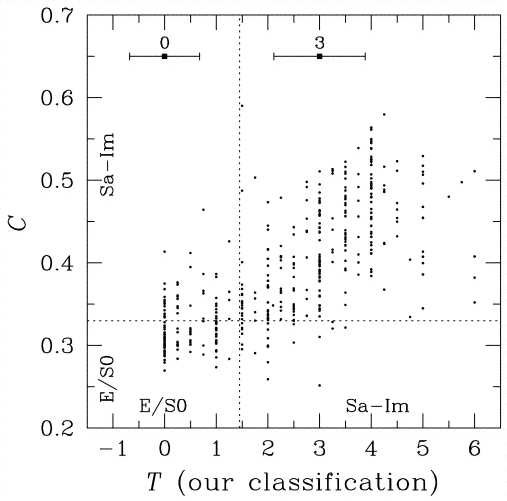
Figure 10 from
Shimasaku et al., AJ 122, 1238 (2001)
 Copyright © Michael Richmond.
This work is licensed under a Creative Commons License.
