 Copyright © Michael Richmond.
This work is licensed under a Creative Commons License.
Copyright © Michael Richmond.
This work is licensed under a Creative Commons License.
There are a LOT of stars in our Galaxy (and in other galaxies), and they are quite an inhomogeneous bunch. Some are old, some are young. Some are very hot, others relatively cool. A few are almost as large as the orbit of the Earth, but most are considerably smaller than our own Sun.
When we observe stars from the Earth, we can't always tell the difference between, say, a cool giant at a distance of 5 kpc and a cool dwarf at a distance of 50 pc. If we see a larger number of stars in THAT direction than in THIS direction, it might be due to an increase in the density of stars in THAT direction ... or it could be due to luminous giant stars in THAT direction, and feeble dwarf stars in THIS direction. Trying to figure out how stars are arranged in space is complicated by the fact that we don't -- in general -- know the intrinsic properties of each star.
Our job would be much simpler if we could somehow select for study a set of stars which were all identical. In that case, we would know that if star A appears 25 times brighter in our telescopes than star B, then star B must be farther away from us; in fact, star B must be 5 times more distant. Astronomers in this sort of ideal world could much more easily interpret their observations and turn them into accurate models.
Although we don't live in such an ideal universe, we can make things easier for ourselves by restricting our analysis to some small, homogeneous subset of a larger group of measurements. Picking out a small number of tracers with identical properties can be a powerful technique.
As an analogy, consider how much easier it would be to study, say, the the effects of smoking on life expectancy if we concentrate only on vegetarian women between the ages of 35-40 who live in rural areas and work on farms --- rather than including people of all sexes and ages and livelihoods.
One of the most basic properties of the disk of the Milky Way is its thickness: how far above and below the plane do the stars lie?
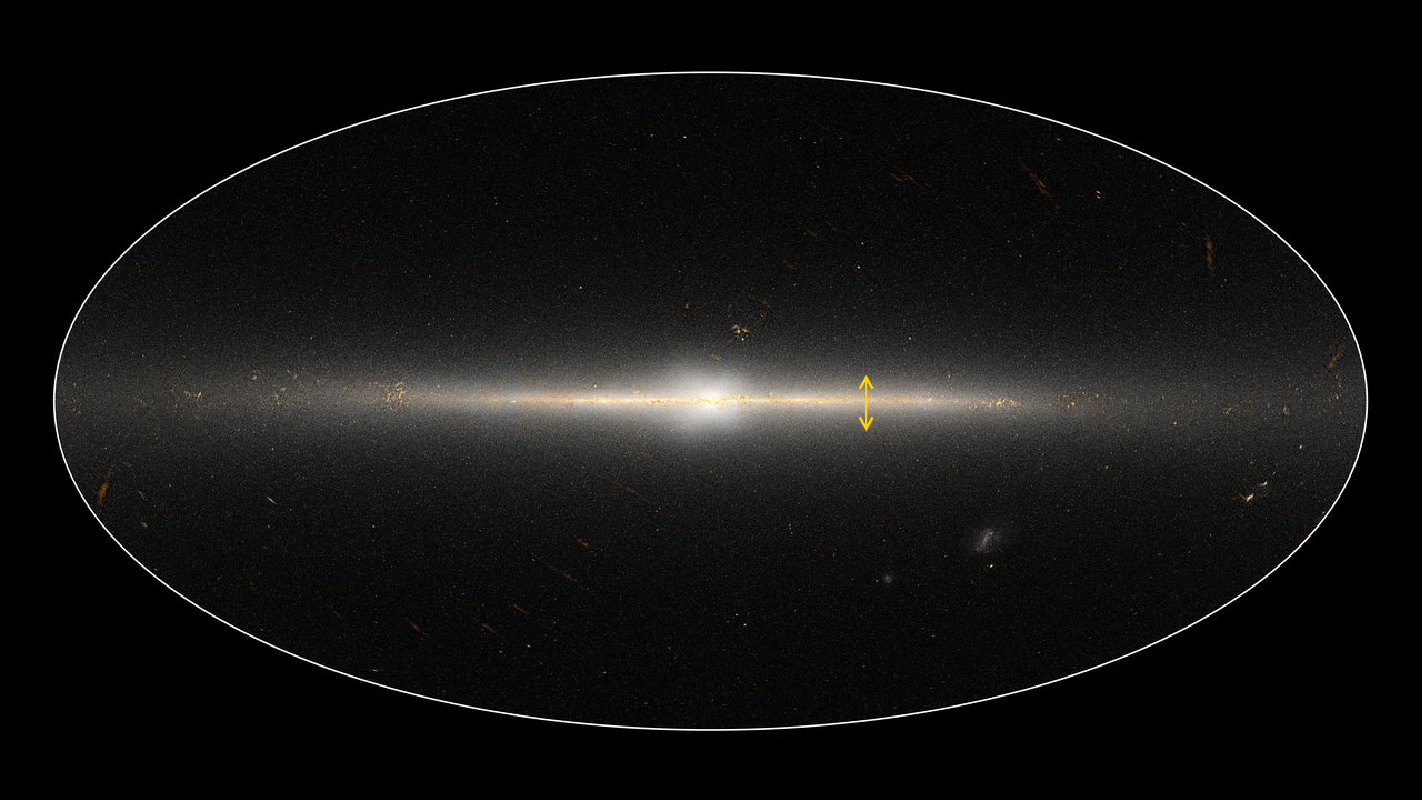
WISE image courtesy of
NASA/JPL-Caltech
Gaia has provided some of the best data to address this question, A recent article provides some good analysis:
The authors first choose a subset of stars which should be members of the disk close to the Sun:
The result is a set of main-sequence stars which are moving around the center of the Milky Way in the disk, just like our Sun.
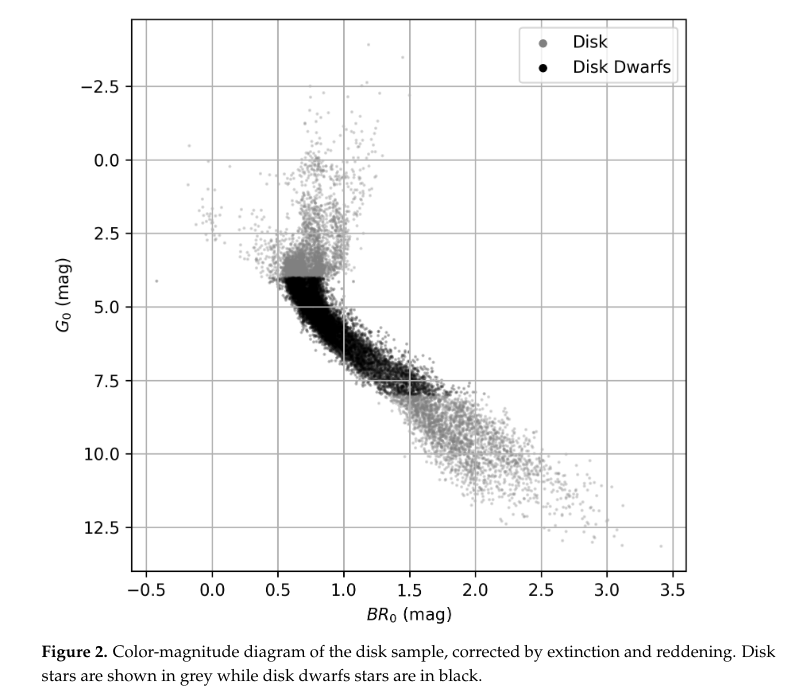
Figure 2 taken from
Vieira, K., et al., Galaxies, 11, 77 (2023)
  Q: The sample has absolute magnitudes down to MG = 8.
     Gaia can measure stars with apparent magnitudes down to mG = 19 or 20.

        Out to what distance d should this sample reach?
Based on the observational limitations of Gaia, the selection should be "complete" out to a vertical distance of about 2000 pc above or below the plane. That is, any stars within this region SHOULD be included in the sample. At large distances, the dataset becomes "incomplete" -- meaning that it will be missing some fraction of the stars.
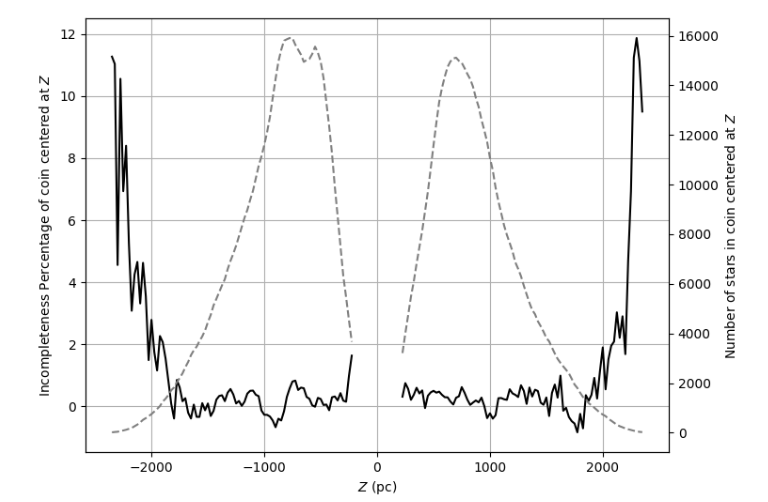
Figure 3 taken from
Vieira, K., et al., Galaxies, 11, 77 (2023)
     The dashed lines in the diagram above show the number of stars
     in the sample as a function of the distance "Z" away from the
     center of the disk.


    Q:  Why does is the number small at Z = 0, then increase
           sharply out to a few hundred parsecs?


    Q:  Why does the number start to decrease at a value
           of Z = 500 or 600 pc?
Vieira et al. noticed that the stars in this region have a wide spread in orbital velocity Vφ. Some stars are orbiting the Milky Way at very high speeds, while others are following at much lower velocities. There appears to be a connection between orbital speed and vertical position: the fast stars are more concentrated towards the plane, while the slower stars rise and fall to greater distances.
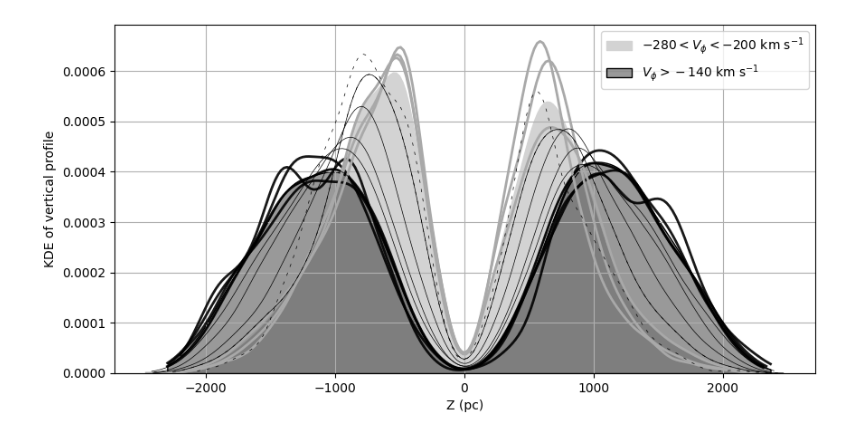
Figure 4 taken from
Vieira, K., et al., Galaxies, 11, 77 (2023)
One common model for the distribution of stars in a galaxy involves an exponential function of the height z away from the plane, something like
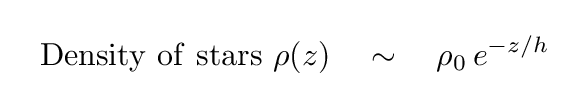
In this type of equation, the constant h in the exponential is called the scale height of the distribution. It's the distance over which the density changes by a factor of 1/e. In very simple terms, it's sometimes used as a very rough approximation for "how far above or below the disk do stars move?" The real answer is, of course, that there is no hard edge to a galaxy -- the stars simply grow less and less common as one moves farther and farther from the center. But even a very rough approximation can be useful for quick calculations or comparisons.
When Vieira et al. fit two exponential models to fit these two populations, the "fast" and the "slow", they find the values for the scale heights shown in the captions below.
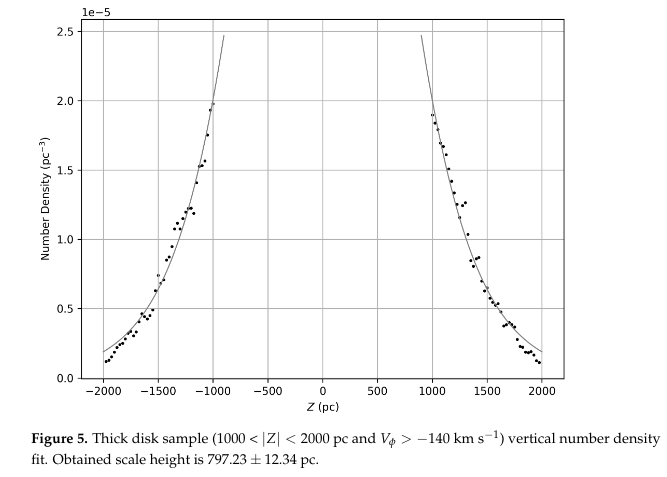
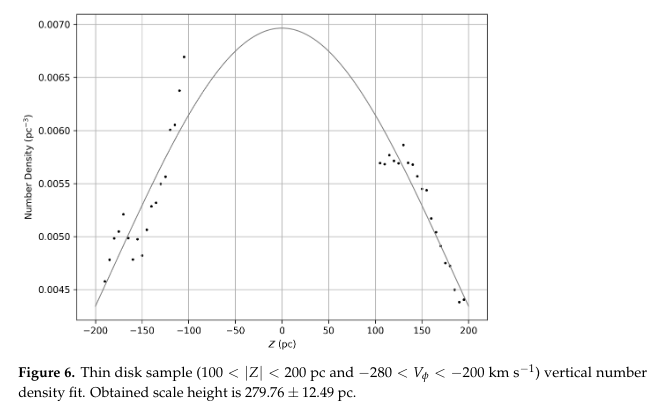
Figures 5 and 6 taken from
Vieira, K., et al., Galaxies, 11, 77 (2023)
  Q:  In the captions to the figures above, the words "thick disk"
          and "thin disk" are used to describe the two groups.
          Why?
Here's another view of the two models.
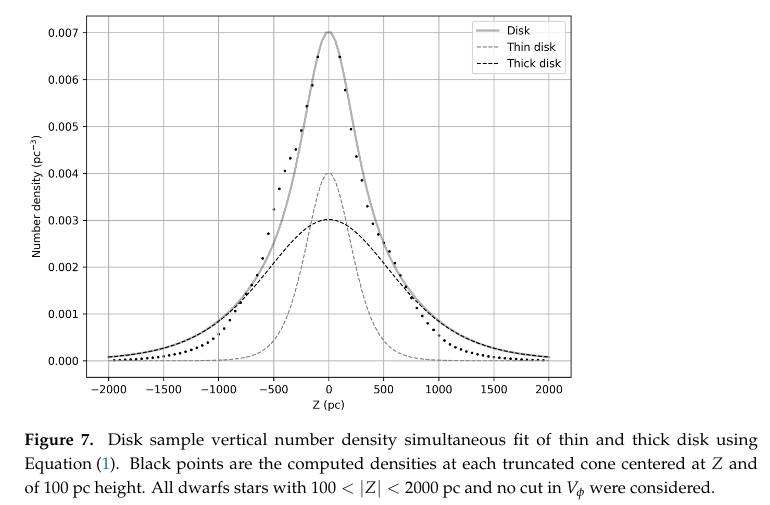
Figure 7 taken from
Vieira, K., et al., Galaxies, 11, 77 (2023)
Let's summarize: the KINEMATICS (motions) of stars in the disk of the Milky Way indicate that there are two groups of stars:
Are there really two groups of stars in the disk of the Milky Way? Observations of stellar motions aren't the only evidence of some sub-structure in the disk. If we mix in some other observations, we might end up with a coherent story that explains it all.
Let's put stars aside for a moment and consider the space between the stars: the InterStellar Medium (ISM). In particular, let's look at "cold" hydrogen gas clouds; the word "cold" here means "gas at temperatures of tens to hundreds of Kelvin." We'll leave the warm and hot gas for later in the semester.
Both of the stellar disks are considerably thicker than the distribution of cold gas within the Milky Way. Neutral atomic hydrogen gas (HI) is located in a layer close to the plane, as the figure below shows. Although the gas does flare out at large distances from the center of our Galaxy, at the Sun's distance (about 8 kpc), it is a very thin layer -- only about 100 pc thick.
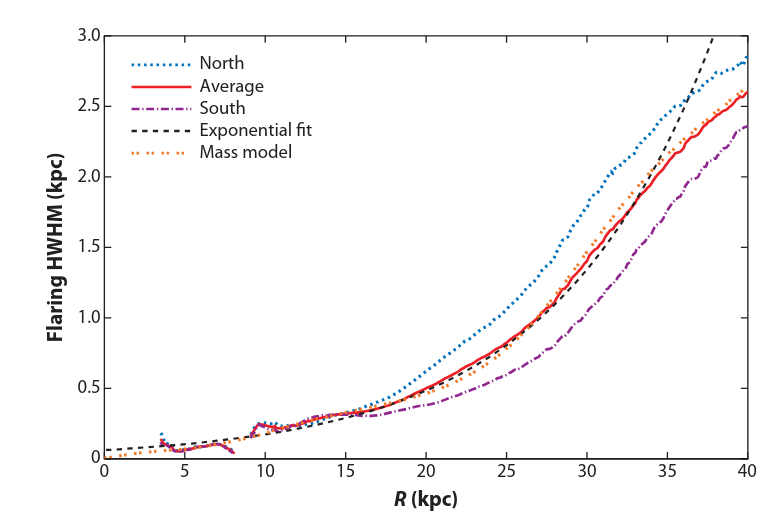
Figure 6 taken from
Kalberla, P. M. W., and Kerp, J., ARA&A 47, 27 (2009)
The same is true for molecular hydrogen gas, H2. The figure below shows measurements from several other galaxies, but the results are representative of the Milky Way, too.
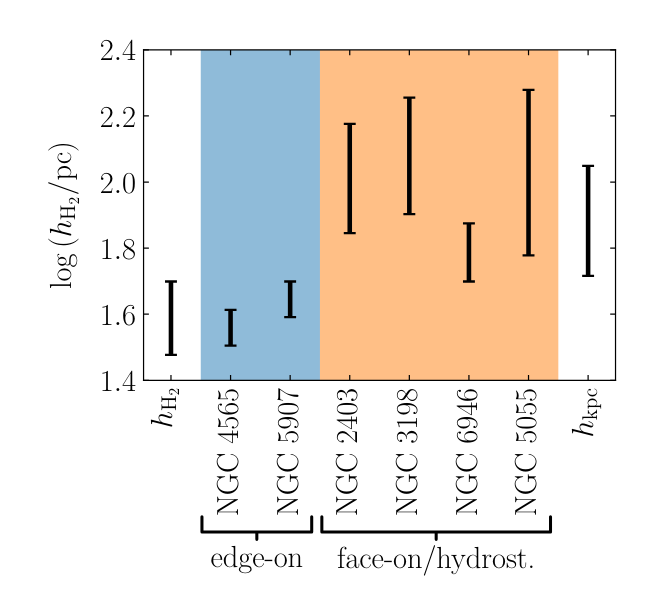
Figure 9 taken from
Jeffreson, S. M. R., Sun, J., & Wilson, C. D., MNRAS 515, 1663 (2022)
Kalberla, P. M. W., and Kerp, J., ARA&A 47, 27 (2009)
Now, the dynamics of stars and clouds of gas are quite different. Stars interact with each other mainly via gravitational interactions at very large distances: as stars fly through the Milky Way, they don't run into and collide with other stars. Instead, they remain separated by many thousands or tens of thousands of their own diameters, like tennis balls scattered hundreds or thousands of kilometers apart. Their gravitational interactions add small, random perturbations to their velocities once every million years or so. We'll discuss the long-term effect of these little nudges later in the course.
Gas molecules, on the other hand, even in the low-density clouds in space, bang into each other and collide relatively frequently. Their interactions are due to these "physical" collisions, which are mediated by the electromagnetic force, rather than by gravity. The dynamics of gas are dominated by these collision between atoms and molecules. leading to much more rapid dissipation of energy.
The bottom line is that we would expect a disk composed of clouds of gas, all orbiting the center of the Milky Way, to remain very close to the plane. That is exactly what we see.
What about stars? New stars are born from the clouds of cold molecular gas in the disk. So the very youngest stars in the disk of the Milky Way should also have orbits which remain close to the plane. Their distribution should have a small scale height, too.
Over time, stars will gradually gain little bits of velocity in all directions, including those perpendicular to the plane. But because stars, unlike gas, are collisionless, these randomly growing vertical motions are not damped. As a result, the scale height of a bunch of stars which were born close to the plane will gradually increase. It's a slow process, but over billions of years, the typical vertical component of stellar velocities will increase -- and so will their range of vertical locations.
This story predicts that, if we could measure the ages of stars in the disk, we'd find younger stars, on average, in the thin disk. And that's exactly what we DO find.
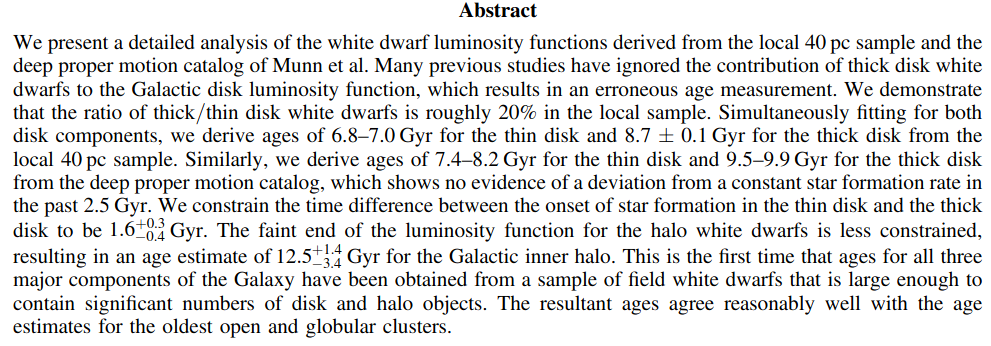
Abstract of
Kilic, M., et al., ApJ, 837, 162 (2017)
Astronomers have collected evidence for a change in the MOTIONS of disk stars, and the AGES of disk stars, as a function of their position. We can add another type of evidence: CHEMICAL COMPOSITION.
Before Gaia, astronomers were able to measure the chemical makeup and motions for hundreds of thousands of stars. The figure below compares the "metallicity" -- which means "fraction of elements heavier than helium" -- with the rotational velocity of stars above the plane of the disk. As you can see, there appear to be two groups of stars, separated by their rotational speeds AND by their metallicity.
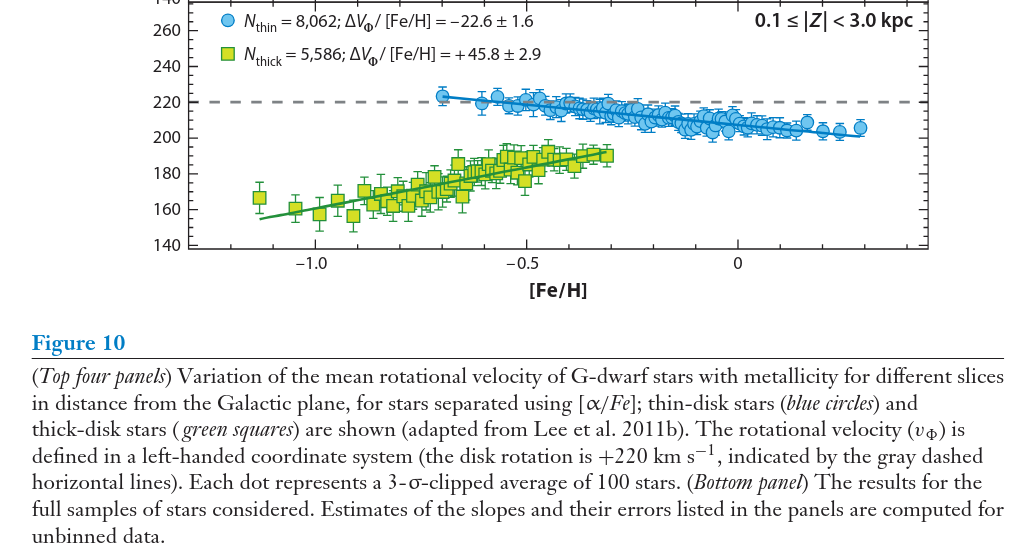
Figure 5 taken from
Ivezic, Z., Beers, T. C., & Juric, M., AR&Å, 50, 251 (2012)
The Gaia spacecraft increased our sample of stars by to millions and millions. It did more than count stars and measure their distances and luminosities, and motions; for a subset of the brighter stars, it also measured the elemental makeup of their outer atmospheres. That means that we can search through the Gaia dataset to find clues about the formation and evolution of our galaxy.
If one examines metallicity as a function of distance above or below the plane, then one finds a very clear pattern:
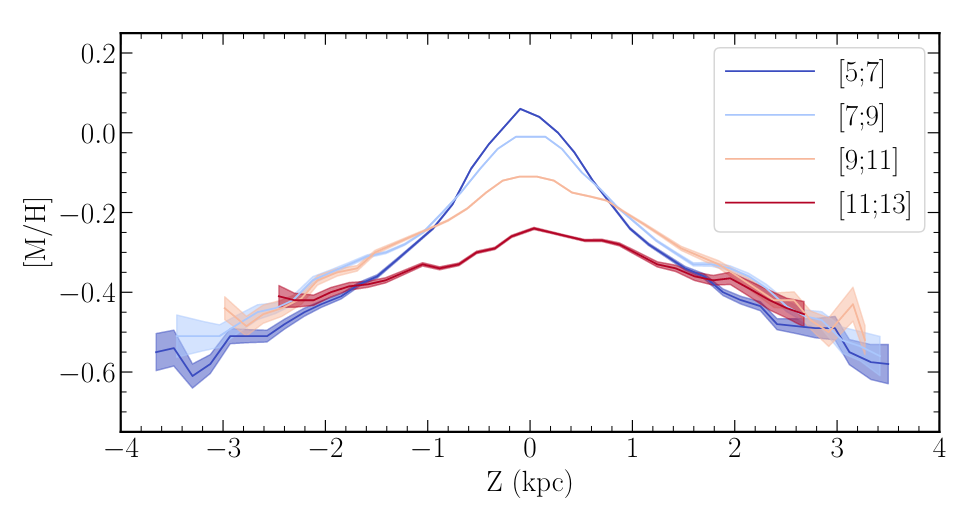
Taken from Figure 13 of
Gaia Data Release 3: Chemical cartography of the Milky Way
by Gaia Collaboration; Recio-Blanco, A., et al.,
A&A (2022) in press.
The different colored lines correspond to samples taken
at the given radial distances from the center of the galaxy.
  Q:  Can you think of any reason(s) why stars in the very
          plane of the disk might have the highest metallicity?
There's also a RADIAL gradient in the metallicity of stars, as one moves from the center of the Milky Way outwards: in general, the metallicity is highest near the center and lowest in the outer regions. However, that depends on exactly which stars one measures. Stars shown in blue below are those closest to the middle of the plane of the disk, while stars shown in red lie at some distance from the plane.
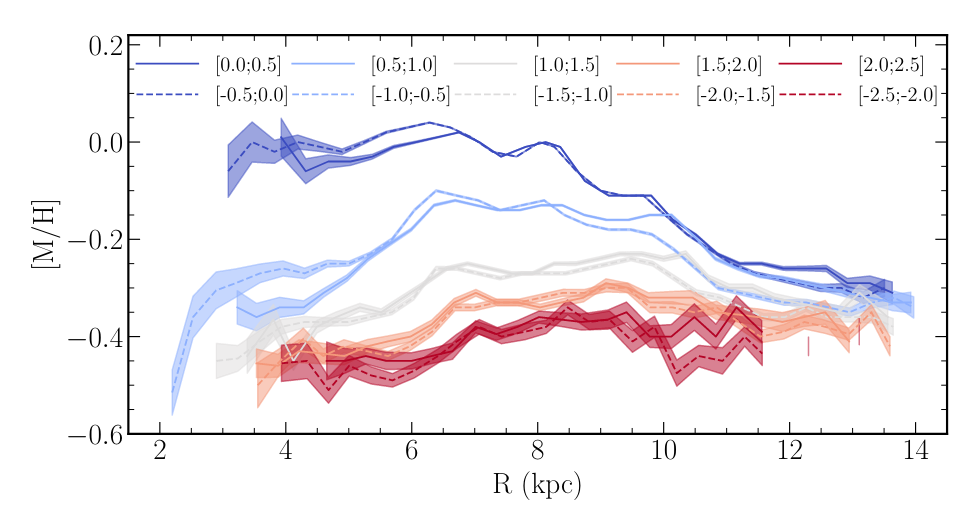
Taken from Figure 13 of
Gaia Data Release 3: Chemical cartography of the Milky Way
by Gaia Collaboration; Recio-Blanco, A., et al.,
A&A (2022) in press.
The different colored lines correspond to samples taken
at the given vertical distances from the plane.
When we look at some spiral galaxies, we see evidence for a slight "twist" or warp in the shape of the disk. Perhaps the gravitational forces during a close encounter with another galaxy produce these distortions.
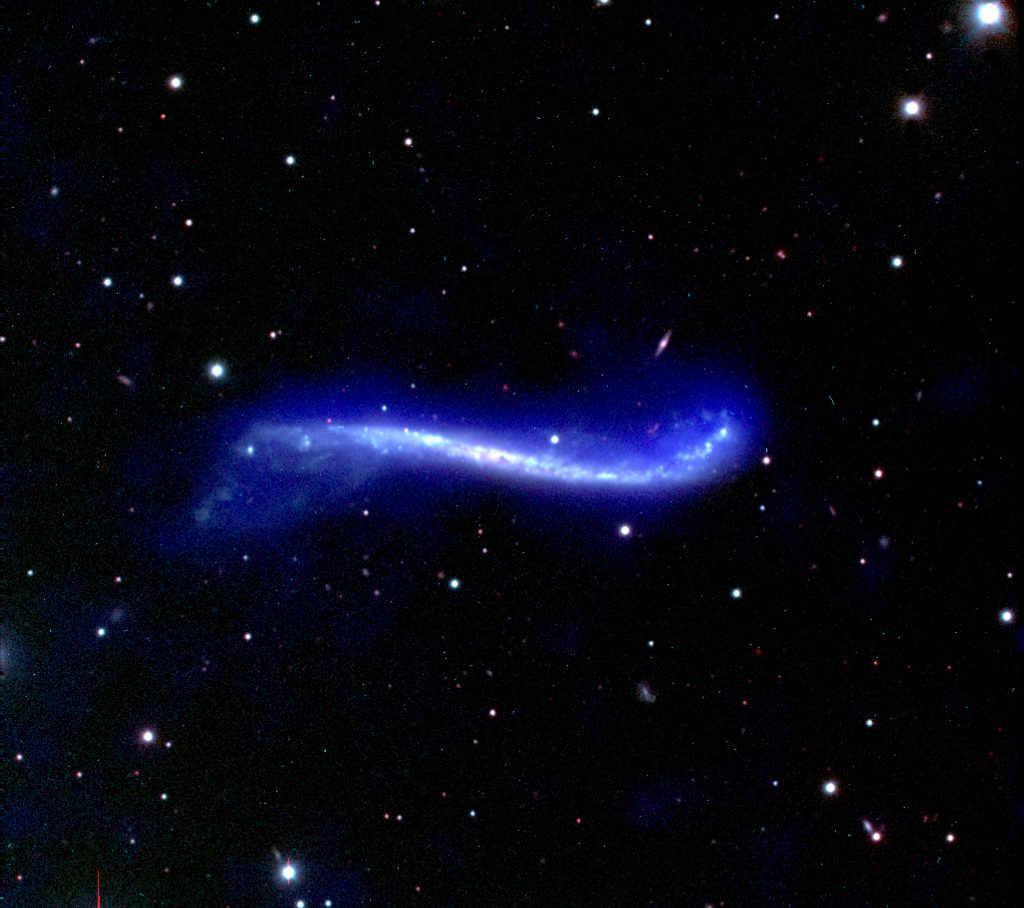
Image of UGC 3697 courtesy of
NRAO/AUI/NSF, Image copyright J. M. Uson (NRAO), observers L. D. Matthews (CfA), J. M. Uson (NRAO)
Does the plane of our own Milky Way have a similar twist? Several lines of evidence suggest that it does -- leading to headlines like this:

Headline from
NBC News (Aug 5, 2019)
What is the evidence for these claims? Below are two lines of evidence, each of which uses a particular type of star as a tracer of the disk's structure.
And look at how that position changes as one selects stars in different sectors of the galaxy!
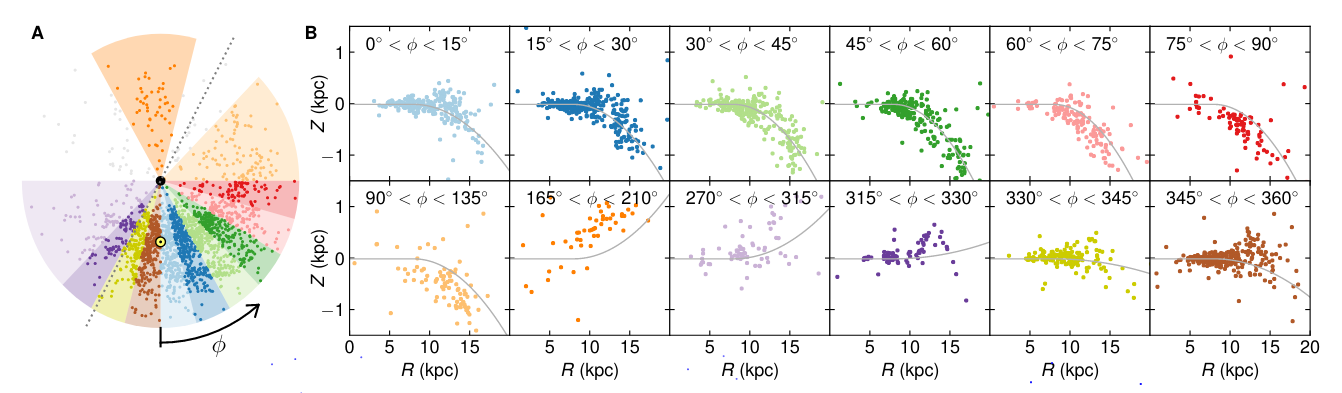
Image taken from Figure 2 of
Skowron et al., axXiv 1809.10653 (2019)
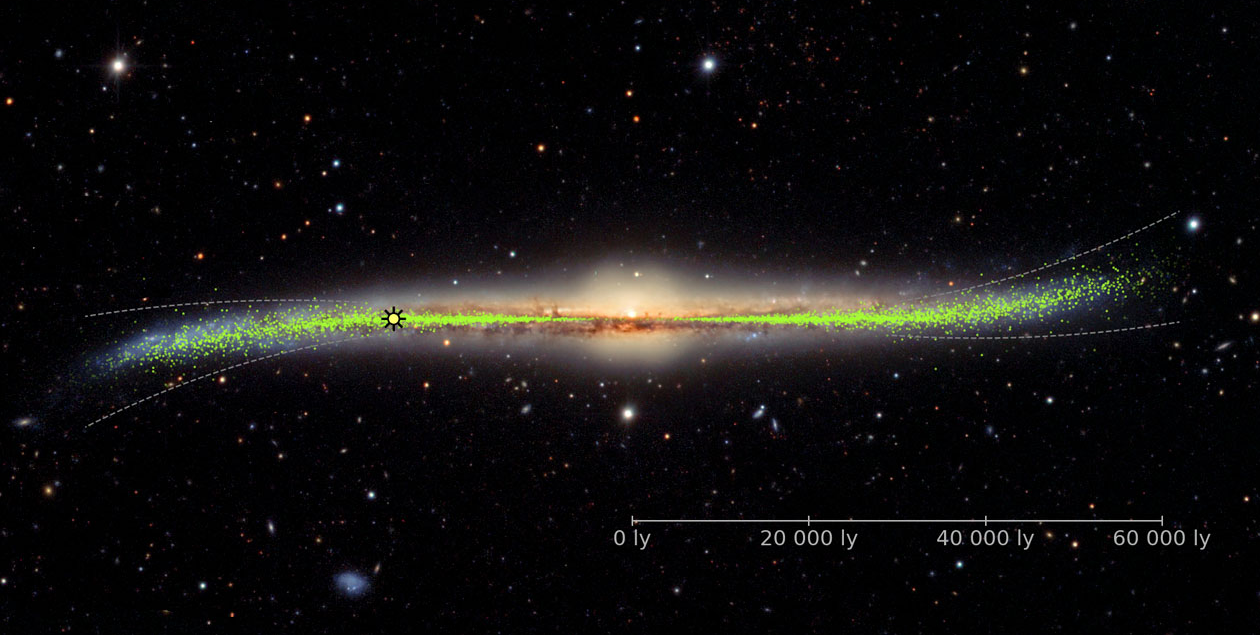
Image courtesy of
J. Skowron/OGLE/Astronomical Observatory, University of Warsaw
Below is a map of several models: each symbol shows the location of the mean of a bunch of stars in the (X, Y) plane of the disk, and the COLOR of the symbol is related to its VERTICAL position. Note that a perfectly flat disk will yield a map which is uniformly grey, indicating no variations in height from one region to another. A warped disk, on the other hand, will show a clear pattern.
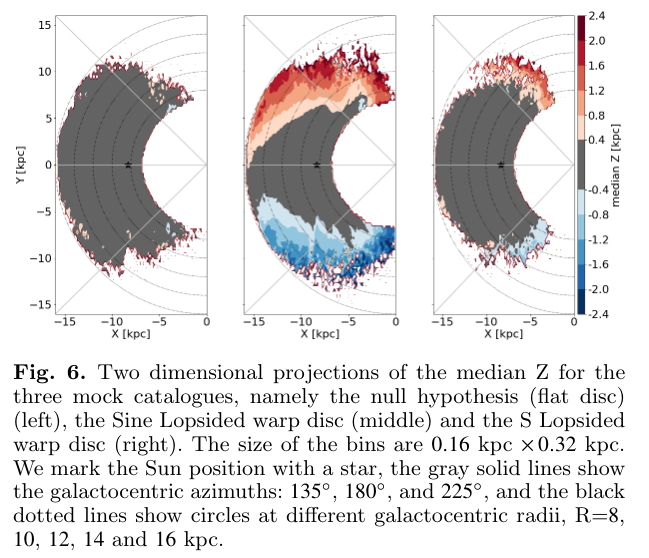
Figure 6 taken from
Romero-Gomez et al. (2019)
The actual Gaia measurements are shown in the figure below. It's clear that there is a systematic difference between stars on one side of the Sun and stars on the other side.
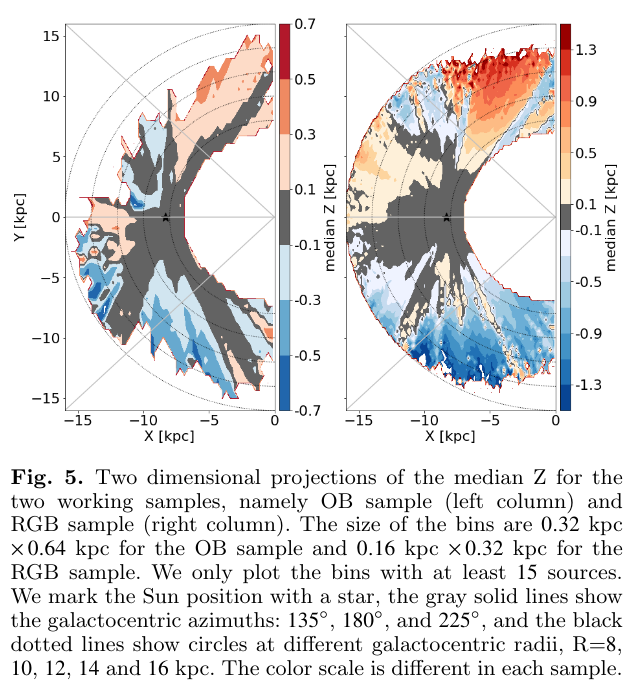
Figure 5 taken from
Romero-Gomez et al. (2019)
Copyright © Michael Richmond.
This work is licensed under a Creative Commons License.