Work in Lifting a block
You are holding a block of mass 2 kg
initially at rest. You then pull upwards,
lifting the block by 50 or 60 cm,
and end with the block again at rest.


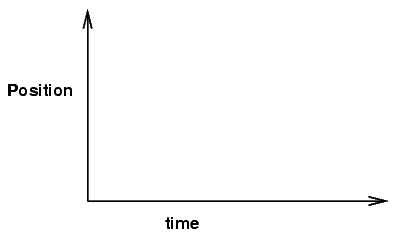
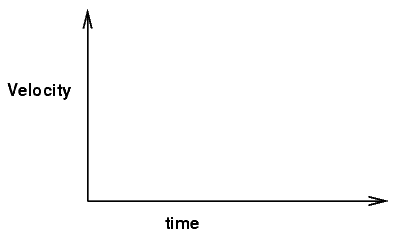
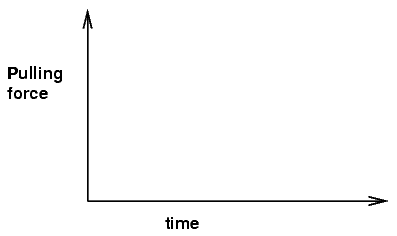
- * Sketch predictions of the position, velocity, and pull as
functions of time.
- * Predict the change in kinetic energy of the block.
Now do the experiment
- Drag the file lift_block from the
server
         Student Shares on 'svphy01' (S:)
            University Physics Students
              Team Physics 311
                 Lab Pro
                    lift_block
to the Desktop. Connect
the Labpro interface to the computer,
a motion sensor to Dig/Sonic 1 and a
force sensor to CH1. Be sure that the force sensor is on the 50 N
setting. The motion sensor should sit on the floor with a
protective cage over it.
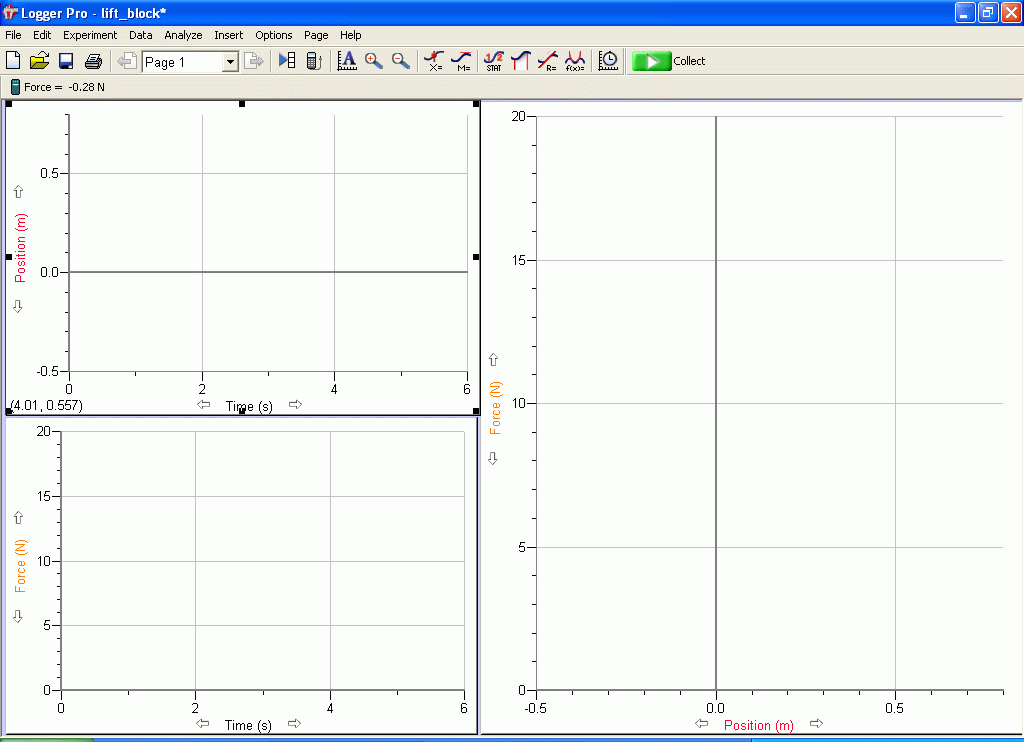
Double-click on the lift_block icon on your Desktop
to run LoggerPro.

-
Calibrate the force sensor.
Select Calibrate,
under
the "Experiment" menu,
then Dual Range Force Sensor,
then click Calibrate Now.
Hold the force
sensor vertical and enter 0 N and keep this result. Hang the 2 kg
from the sensor, enter the appropriate force and keep.
Click Done and Close.
- Zero the force sensor while there is no weight hanging from it.
- Zero the motion sensor by holding your hand motionless above
it, roughly at the height of the tabletop.
- * The motion sensor is a bit touchy. It will yield bogus results
if the object it is watching comes too close to it,
or moves too far away. Click Collect a few times
and wave your hand up and down over the sensor to find
the critical points.
Write down the minimum and
maximum distance over which the sensor
gives accurate results.
- Hold the force sensor with the block attached
vertically above the motion detector, at about the
height of the tabletop.
Click Collect, stay at rest for 1 sec, quickly but
smoothly raise the block about 40-60 cm,
and then hold the block steady at its new height.
Don't pull too fast or the force sensor will give
noisy results.
Here's an example
of some good data
- * Were your predicted shapes for the position-time and
force-time graphs correct?
If not, sketch what you actually
observe and explain the reason for the differences.
- * Through what vertical distance did you lift the block? Use
statistics on the position-time graph to answer this. You should
have a distance and a standard deviation in the distance.
       Initial height =

       Final height =

       Height moved =
- * Make force versus distance graph active (click in its window).
Under Analyze,
pick Integral to find the work done by your
pull as you raised the block.
Work of my pull =
- * What are the initial and final kinetic energies for this
experiment?
- * The Work-Kinetic Energy Theorem claims that

Is this true for your experiment within the uncertainties? If not, why not?
If you have time ....
Look at the graph in the upper-left corner of the screen.
It should show position as a function of time.
- Modify the graph so that it shows both position
and velocity as functions of time.
- * Explain how the shape of the velocity curve
is related to the shape of the position curve.
- * Integrate velocity over time. What is the result?
How does it compare to your answer to question 8?


