 Copyright © Michael Richmond.
This work is licensed under a Creative Commons License.
Spectroscopy does more than tell you the temperature and chemical composition of an object; it can also reveal the radial velocity of the object as a whole, and even describe the internal motions within an object.
We can measure the wavelengths at which each element absorbs light in a lab, here on Earth. The element calcium, for example, aborbs light of wavelengths
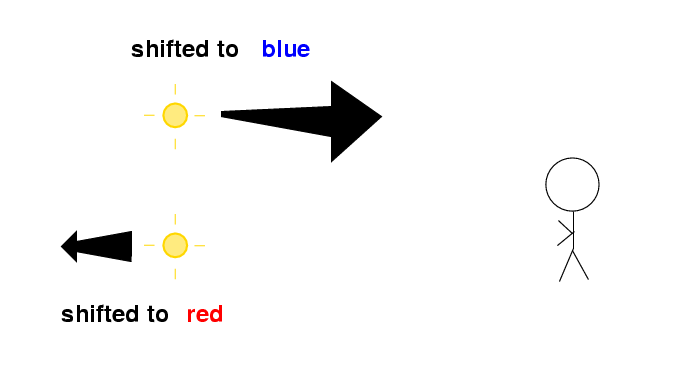
Now, it turns out that if the material absorbing light is moving towards or away from us with some radial velocity, we see shifts in the location of the absorption lines:

This is called the Doppler effect. The size of the shift in the lines depends on the size of the radial velocity. For relatively small velocities,
                                             radial velocity
     shift (nm)   =  rest wavelength (nm) *  ---------------
                                             speed of light
Thus, for the calcium H and K lines,
     radial velocity       calcium K       calcium H
  ------------------------------------------------------
         0  km/sec          393.3 nm        396.8 nm

       100  km/sec          393.4           396.9

      1000  km/sec          394.6           398.1

    10,000  km/sec          406.4           410.0
By comparing the observed wavelengths of spectral lines to the lab values, we can figure out the motion of the object towards us or away from us. It doesn't tell us everything, since it reveals nothing of the transverse motion, across our line of sight; but it is still a very powerful technique.
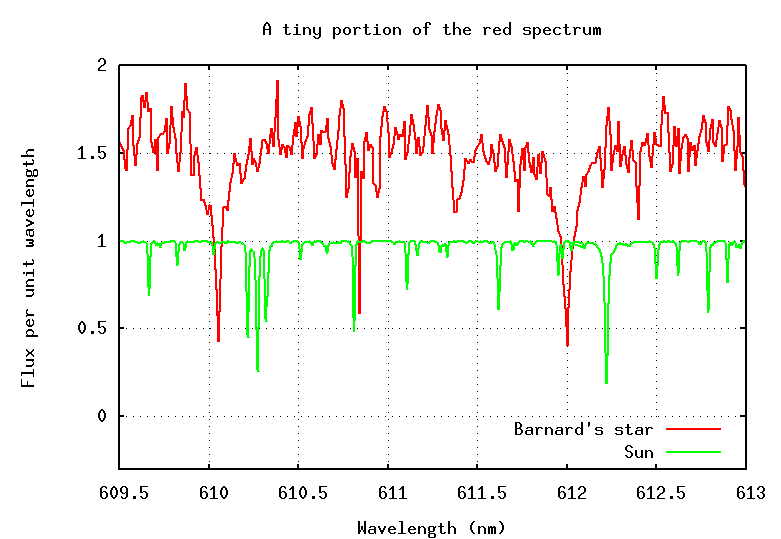
Let's try to measure the radial velocity of an ordinary star in the solar neighborhood. The star Arcturus is relatively nearby, and not too different from the Sun in temperature. If we zoom in on a very small region of the spectrum of each star, we see similar absorption lines. The small offset in wavelength is due to the motion of Arcturus.
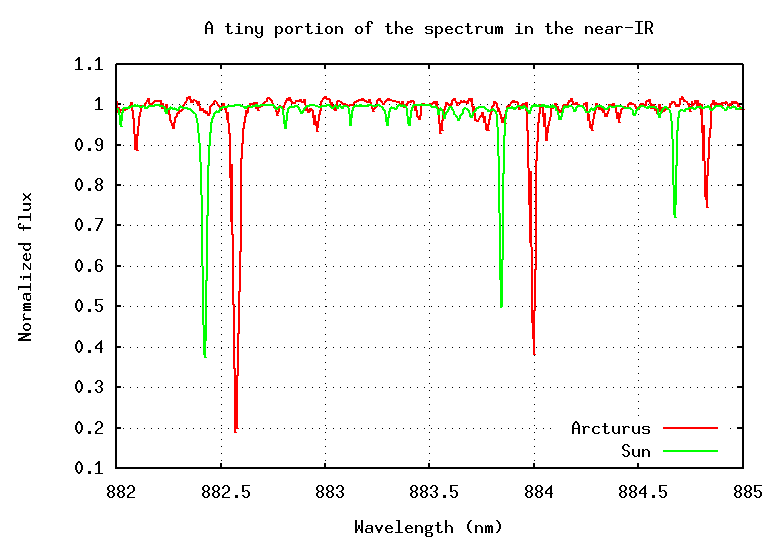
  Q:  What is the radial velocity of Arcturus?
      Is it coming towards us, or going away from us?
Galaxies are collections of billions of stars far, far beyond our Milky Way. We can measure the spectrum of a galaxy in the same way as that of a star: point our telescope at the galaxy, send all its light through a spectrograph, break it up into its component wavelengths. The result will be a composite spectrum, the sum of all the spectra from individual stars and clouds of gas in the galaxy. This composite spectrum tells us about properties of the galaxy as a whole.
Remember the spectrum of the planetary nebula from yesterday's lecture? It contained several very strong emission lines. Two of the strongest lines are due to excited hydrogen gas:
    Line         Rest Wavelength
    ----------------------------
    H-beta          486 nm
    H-alpha         656 nm
    ----------------------------
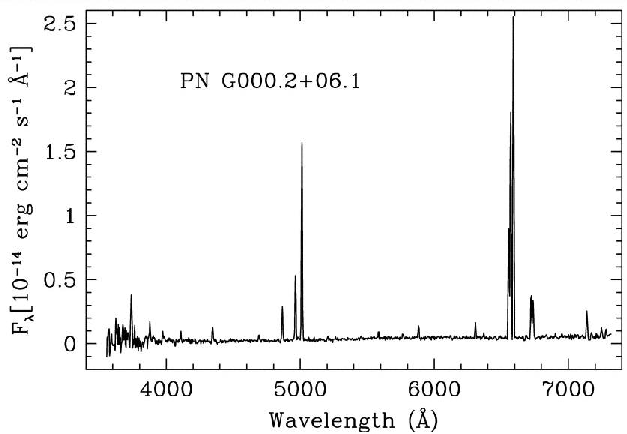
Some galaxies have many very hot, thin clouds of gas, so they, too, have emission line spectra:
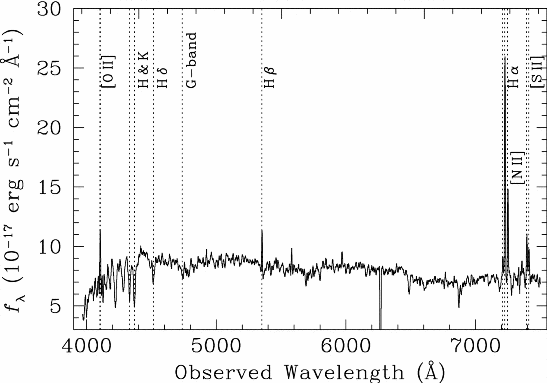
Note the wavelength units: divide by 10 to get nm!
   Q:  What are the wavelengths of the H-beta
       and H-alpha lines in this galaxy's spectrum?

       What is the shift in wavelength for each line
       from the rest wavelength?

       How fast is this galaxy moving?  In which direction?
Now, what happens if an object is rotating?
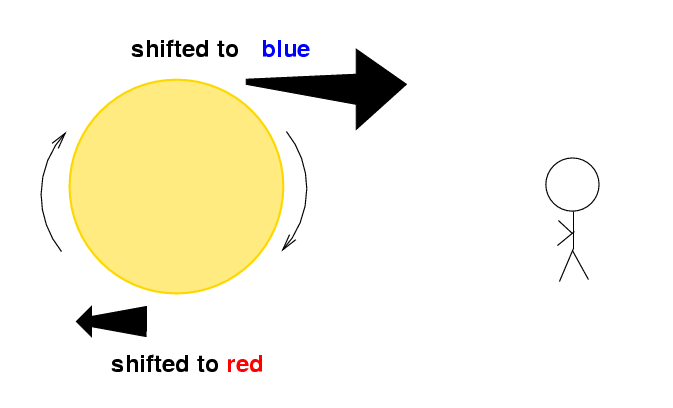
If the object is close enough to us, we'll see one edge blue-shifted and the other edge red-shifted. But if the object is very far away, so far that the object appears as a single tiny dot of light, we'll see light from all regions of the object at once.
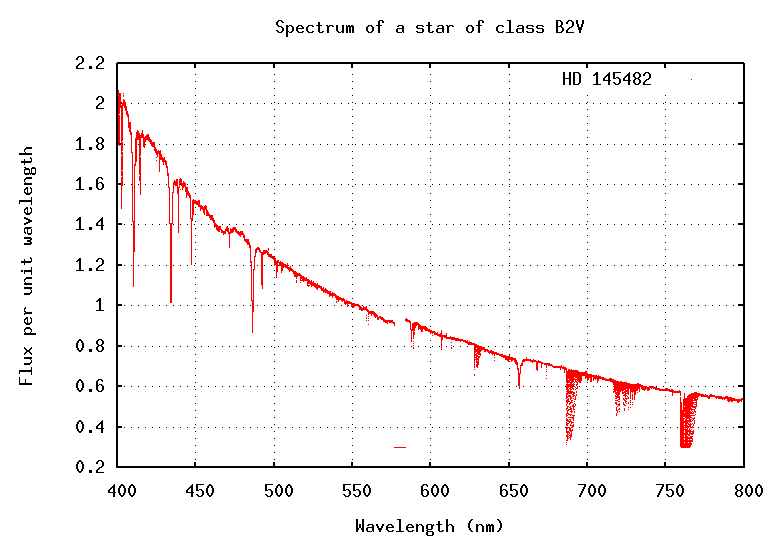
If the object is rotating quickly, this mixture of wavelengths will cause individual lines to be spread out. We call this rotational broadening. Consider the star HD 145482. Its optical spectrum shows that it is very hot.
If we zoom in on one time region of the spectrum, at around 492 nm, we can see that its absorption lines are much broader than those of the Sun:
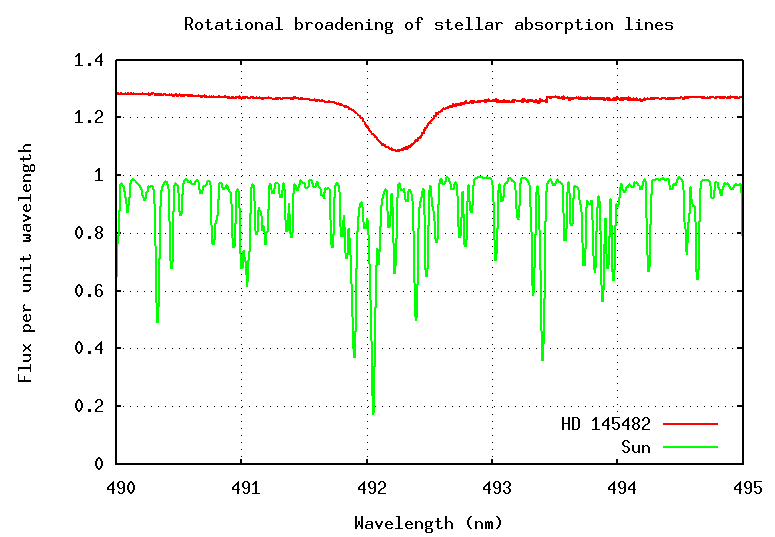
  Q:  Can you figure out how fast the star is rotating?
      Measure the Full-Width-at-Half-Minimum (FWHM) of the
      line: its width at a point halfway to the bottom of the
      absorption feature.  Then use this formula to find the
      effective shift due to rotational motion.

          effective shift   =  FWHM / 2.35


      How fast is the star rotating?
The answers
Astronomers can find the rotation of an entire galaxy in the same way: look for shifts in the wavelengths of lines. Since many galaxies are large enough that we can resolve them with telescopes, we can often measure the wavelengths of light emitted by each side of the galaxy separately.
For example, consider the galaxy UGC 2936:
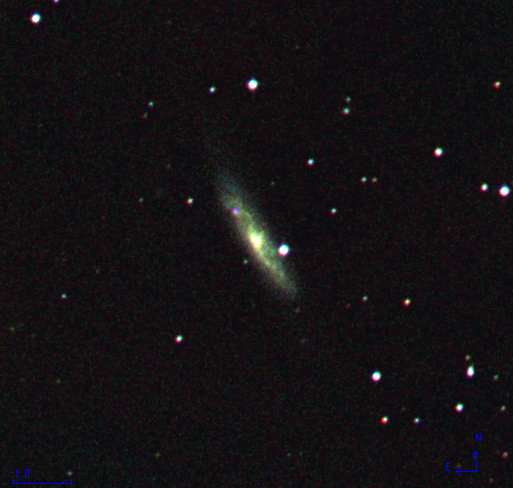
Astronomers placed the slit of a spectrograph along the long axis of this galaxy ...
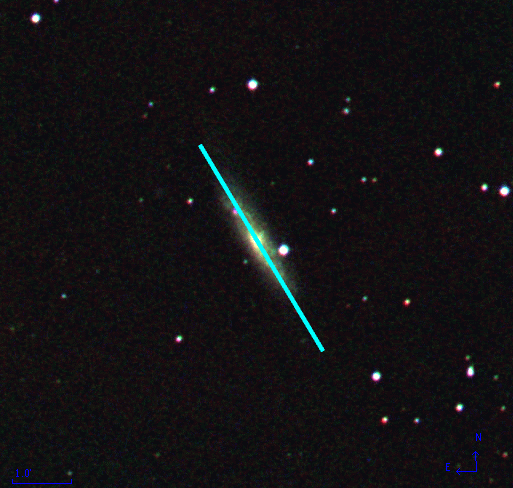
... so that they could separate the light emitted by each end of the galaxy on their spectrum. On this two-dimensional picture of the spectrum, you can see both wavelength and position along the slit in the region of the hydrogen Balmer alpha line.
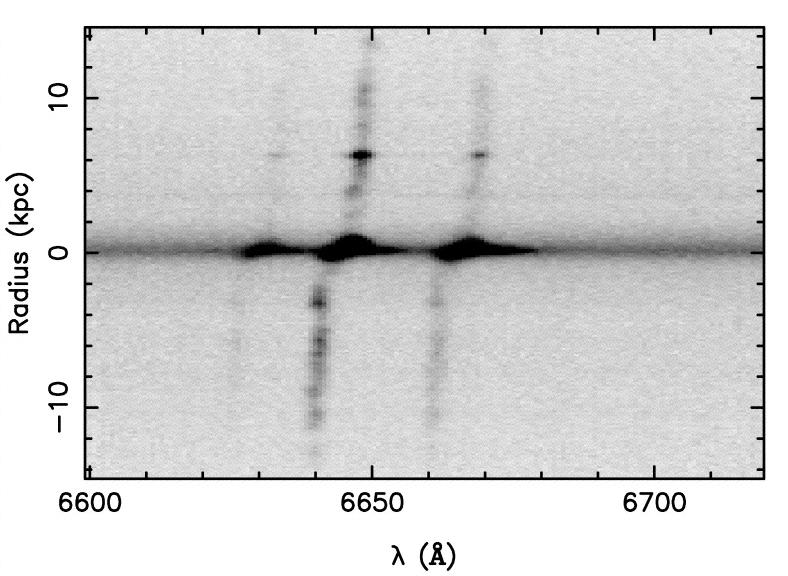
Note the wavelength units: divide by 10 to get nm!
   Q:  What is the shift in wavelength between light emitted
       by the bottom edge of the galaxy and light emitted by
       the top edge of the galaxy?

       How fast is the galaxy rotating?
The answers; see also this figure.
Spectroscopy can uncover orbital motions, too. If two stars orbit around each other in a plane which is edge-on to our line of sight, then we will see each star come towards us, then away from us, then towards us, then away from us ...
In many cases, the orbiting bodies are so far from Earth that we cannot resolve them: images just show a single blob of light. But spectroscopy can still reveal the presence of two objects, because we can separate the light from the stars by wavelength.
In fact, astronomers have used this technique not only to study stars orbiting stars, but also to find planets orbiting stars. If you measure the wavelengths of a star's spectrum very, very, VERY carefully, you may notice tiny little changes in its radial velocity. Notice the scale on the figure below: it is marked in meters per second, not kilo-meters per second.
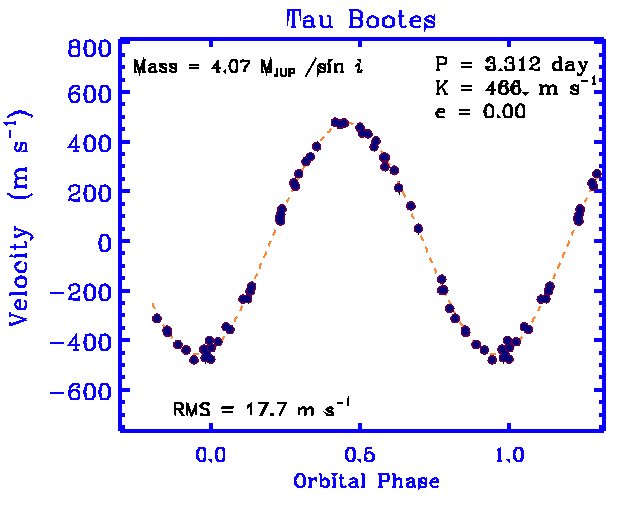
  Q:  How large would the shift in wavelength
      of the hydrogen Balmer alpha line be due
      this orbital motion?  The rest wavelength
      of Balmer alpha is 656 nm.
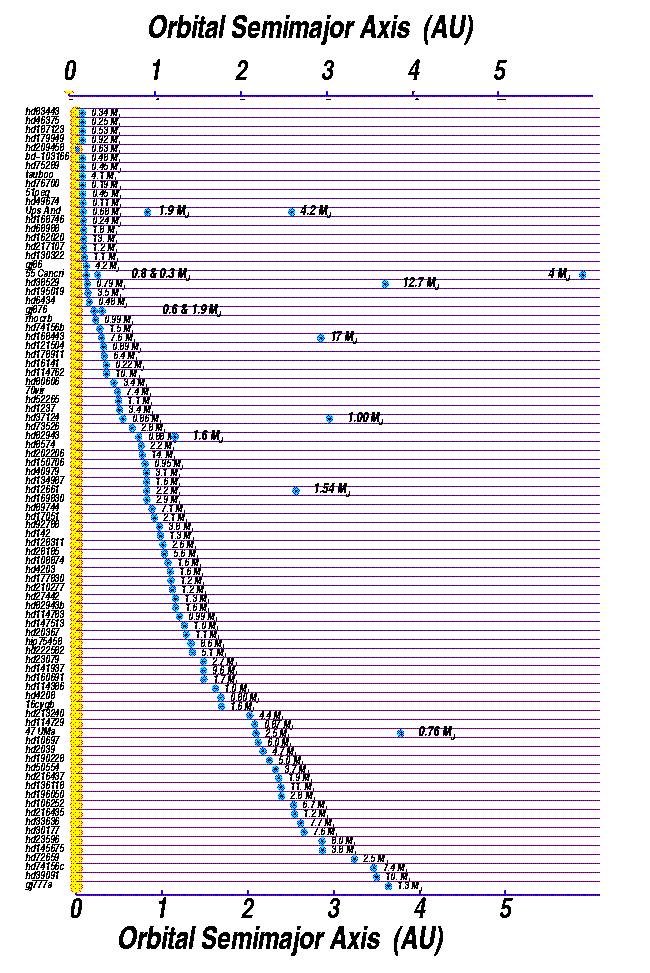
This technique of measuring radial velocities of stars very carefully has led to the discovery of over 100 planets orbiting other stars.
For more information
 Copyright © Michael Richmond.
This work is licensed under a Creative Commons License.