 Copyright © Michael Richmond.
This work is licensed under a Creative Commons License.
Exercise in spectral classification
Today, you will do a little spectral classification.
In the old days, this was done by comparing by eye
the tiny photographic spectrum of a star to a chart of
template spectra;
very tedious, and somewhat qualitative.
These days, fortunately,
you can use a nice software package that makes it relatively simple.
The
Contemporary Laboratory Exercises in Astronomy (or CLEA for short)
project has created several nice projects you can do on a
computer.
One of them involves the classification of stellar spectra.
Let's do that today.
Part I: classify stars
- Log into the computer and find the "VIRGO" entry
under all programs
- When the program starts, choose File -> Log in.
Enter any name you like -- we won't
be using the automatic recording facility
- Choose the File -> Run Exercise ->
Classification of Stellar Spectra item.
You should see a splash screen, followed by
"No Telescope Accessed"
- Choose Tools -> Spectral Classification
This should cause a new window to appear.
- Choose
File -> Atlas of standard spectra ,
then pick "Main Sequence".
You can move up and down through the list of standard
spectra with the "Up" and "Down" buttons.
- Finally, choose
File -> Spectral line table .
A new, smaller window will appear. Drag
it to the side. This window shows a list of
lines produced by specific elements and ions.
Double-click on a line in the table, and the line
will be highlighted in the spectrum. Double-click
on a feature in the spectrum, and the corresponding
line and element will be highlighted in the table.
- In the "Classify Spectra" window, choose
File -> Unknown Spectra -> Program List .
This will load a list of stars which you must classify.
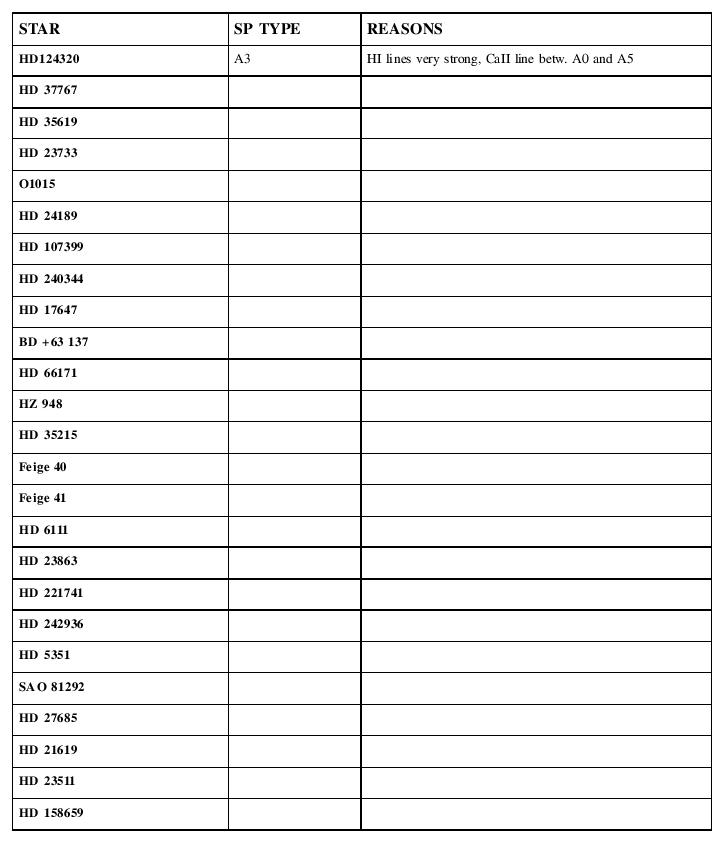
You must go through the list of stars and estimate the
spectral class of each one. Fill in the Data Table handout
(shown below)
with your answers.

Part II: make an HR diagram
Okay, you should have a list of stars and their
spectral classifications.
In the table below, I show the apparent
V-band magnitudes and the measured parallaxes
to the stars you have classified.
The parallax values are taken from the Hipparcos
catalog;
each one has an uncertainty of about +/- 1 milliarcsecond.
# name          parallax(mas)   Bmag   Vmag
HD_124320         5.14        8.98   8.84
HD_37767          1.66        9.03   8.93
HD_35619          0.38        8.79   8.66

HD_23733          7.11        8.73   8.41
O_1015                                      ignore -- no information
HD_24189         10.08        8.97   8.46

HD_107399        13.61        9.62   9.00
HD_240344         1.50        9.42   8.97
HD_17647         15.95        9.38   8.68

BD+63_137        66.46       10.28   8.98
HD_66171         21.15        8.82   8.20
HZ_948            4.33        9.29   8.67

HD_35215          1.22        9.49   9.42
Feige_40          0.73       11.1   11.1
Feige_41          0.30       11.09  11.00

HD_6111          13.77        9.43   8.89
HD_23863          5.98        8.36   8.15
HD_221741         0.47        9.05   8.93

HD_242935         0.41        9.39   9.42
HD_5351          41.45       10.13   9.10
SAO_81292  V    213.0        10.97   9.43

HD_27685         26.96        8.501  7.841
HD_21619          3.97        9.03   8.80
HD_23511          4.00        9.75   9.28

HD_158659         0.20       10.45  10.31
You must use this information to
- calculate the absolute V-band magnitude
of each star
(and, if you wish, the range in absolute
magnitude, based on the uncertainty
in the parallax)
- make an HR diagram for the stars.
Place absolute V-band magnitude
on the vertical axis,
and spectral class on the horizontal
axis. You can divide the horizontal
axis into 7 pieces, one each for
O, B, A, F, G, K, M;
try to sub-divide each piece into smaller
sections so that you can place each
star into its proper subclass.
- indicate on your HR diagram the
following regions:
- main sequence
- giant branch
- white dwarf area
Note that some of these regions may not
contain any of the stars you have classified,
so they may be empty
- Place a special mark on your diagram for each
of the following stars, and tell me what sort
of star each one must be:
- star Q1: spectral class G7,
apparent mag V=8.8, parallax 20.03 milliarcsec
- star Q2: spectral class B5,
apparent mag V=8.5, parallax 434 milliarcsec
- star Q3: spectral class K2,
apparent mag V=9.3, parallax 1.84 milliarcsec
The HR diagram and all the answers to the above
questions are due on Monday, Apr 30
at the start of class.
Friday's class will meet in this computer lab so that
you have a chance to finish the exercise.
For more information
-
The CLEA home page
describes the many CLEA experiments, one of which
is "The Classification of Stellar Spectra", on which
this exercise is based.
 Copyright © Michael Richmond.
This work is licensed under a Creative Commons License.

 Copyright © Michael Richmond.
This work is licensed under a Creative Commons License.

 Copyright © Michael Richmond.
This work is licensed under a Creative Commons License.