 Copyright © Michael Richmond.
This work is licensed under a Creative Commons License.
Copyright © Michael Richmond.
This work is licensed under a Creative Commons License.
The force exerted by a spring
If you try to stretch a spring, it will pull back against
you.
The farther you stretch the spring,
the harder it pulls back.
Can you make this simple description more quantitative?
Your group will need to make TWO sets of measurements,
one with a spring held vertically, one with a spring held
horizontally.
Your group should use the same spring for both measurements.
However, you can coordinate with the other group at your table:
while group A does the horizontal measurements on its spring,
group B does the vertical measurements on its spring;
then, the two groups switch.
- Acquire one small silver spring. Measure its mass and its
length as it lies horizontally at rest on the table.
(Horizontal)
- Arrange clamps and bars as shown in the first diagram above so that you
can hang the spring from a horizontal bar.
Measure the length of the spring as it hangs by itself;
call this Lvert.
- Place 7 various weights, ranging from 0 to 150 grams, on the
bottom of the spring. Measure the length
of the spring for each case.
Compute the distance the spring has stretched
from Lvert.
Include uncertainties in this "distance stretched".
- Calculate the force exerted by the spring in each case.
Make a neat table of all your measurements and calculations.
(Vertical)
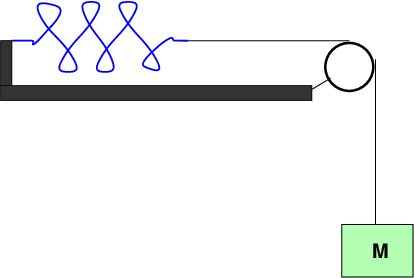
- Now place a track and pulley on your table, as shown
in the second diagram above,
so that you can measure the force of a spring
when it is stretched horizontally.
Make a new set of measurements. You may find
that you can't go up to 150 grams -- in that case,
pick 7 masses which span a smaller range.
(When both sets have been acquired)
- Make graphs, each on its own piece of good graph paper.
Each graph should show force exerted by the spring
as a function of the distance by which the spring
has been stretched.
You should have one graph for the spring hanging
vertically, and (on a different piece of paper)
a graph for the spring lying on its side.
- Use your graphs to compute the "spring constant" or "force constant"
of your spring. Include uncertainties, and make
sure the units of your values make sense.
- Is the "spring constant" of your spring the same
for both orientations? That is, does the
value derived when the spring is vertical
agree (within the uncertainties) with
the value derived when the spring is horizontal?
- Walk around and talk to at least 3 other groups.
Write down their spring constants (with uncertainties)
and compare them to yours.
Are all the springs in class today "identical"?
In order to earn full credit for today's activity,
your group must turn in, in hardcopy on paper,
the following.
Neatness counts.
- table of horizontal measurements
- table of vertical measurements
- graph based on horizontal measurements
- graph based on vertical measurements
- values of the spring constant, derived from both graphs,
including uncertainties in each case
- a statement about the two values -- do they
agree within the uncertainties or not?
- a statement about the spring constant of your spring
compared to those of other groups --
do they agree within the uncertainties or not?
Extra
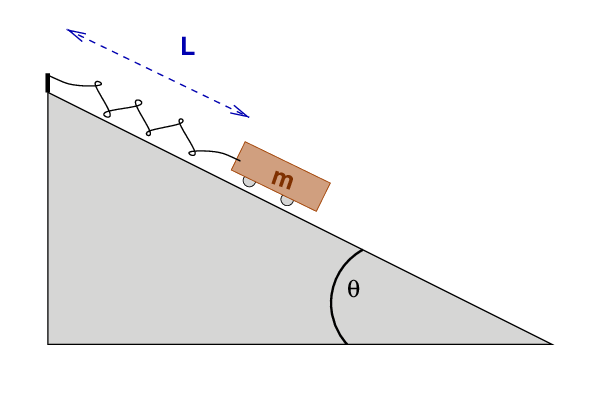
At the center table, I will set up a track
tilted at θ degrees (I'll write the exact value
on the board in class).
We will attach your spring to the track so that it
lies along the track,
and then attach to the lower end
a cart of mass m (I'll provide the
actual mass during the class period).
How long will your spring be when it comes
to rest, supporting the car on this tilted track?
Make a prediction.
  If your prediction is         you gain
    within                    bonus points
  ------------------------------------------
     +/- 2 cm                    +3

     +/- 4 cm                    +2

     +/- 6 cm                    +1
  ------------------------------------------
Copyright © Michael Richmond.
This work is licensed under a Creative Commons License.