 Copyright © Michael Richmond.
This work is licensed under a Creative Commons License.
Copyright © Michael Richmond.
This work is licensed under a Creative Commons License.
Your goal in this exercise is to determine the acceleration of a cart as it rolls down a tilted track ... but, this time, to account for uncertainties in measurements of TIME as well as measurements of distance.
Last time, you analyzed the motion of a cart rolling down a track by calculating velocities from pairs of consecutive positions. This time, you'll use on of the 1-D kinematics equations to do the trick.
Below are a set of measurements I made of the motion of a cart down a ramp. You will note that I did a more careful job this time; the uncertainties in the measurements are all much smaller. There are also uncertainties in the measurements of time.
# Time   Uncert_time   Distance  Uncert_dist
# (s)      (s)            (cm)      (cm)
#---------------------------------------------------

0.5        0.1            7.0         1.1

1.0        0.1           25.1         2.3

1.5        0.1           58.2         3.2

2.0        0.1          101.1         4.2

2.5        0.1          157.6         5.3

3.0        0.1          230.2         6.3

3.5        0.1          315.5         7.2

#---------------------------------------------------
The plan is to use these measurements to make a graph which corresponds to the following equation:
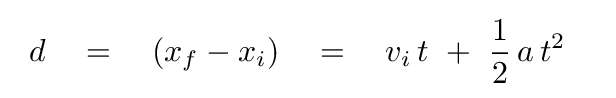
But since the initial velocity of the cart was zero,
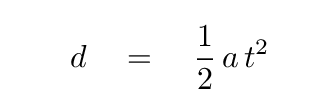
   Q:  In order to make a graph on which the slope is related
           to the acceleration, what should we place on the vertical axis?

           What shall we place on the horizontal axis?
We'll get a nice, straight, linear fit (we hope) if we place
Since the measurements of both time and distance have uncertainties, our graph will need to have errorbars in both the (vertical) distance values AND in the (horizontal) time-squared values.
This is a job for "propagation of uncertainties."
Following the appropriate rules, fill in the values of time-squared and its uncertainty for the cart:
#
#     2                  2
# Time     Uncert_of_time        Distance     Uncert_dist
# (s^2)        (s^2)              (cm)            (cm)
#-------------------------------------------------------------

                                   7.0            1.1

                                  25.1            2.3

                                  58.2            3.2

                                 101.1            4.2

                                 157.6            5.3

                                 230.2            6.3

                                 315.5            7.2

#-------------------------------------------------------------
When you are finished, check your values against those of other people in the class. Ask an instructor to come over and verify that they are correct.
Now that you have a set of the appropriate measurements, and their uncertainties, we can make a graph from which it is possible to extract the acceleration of the cart ... and the uncertainty of that acceleration.
      Use the graph supplied by the instructor, and mark your
      work on that graph.  Use additional paper as necessary.

        a) Find the slope.  Write it down.

        b) Determine the uncertainty in the slope.  Write it down.

        c) Compute the acceleration of the cart.  Don't forget the units.

        d) Compute the uncertainty in this acceleration.

        e) Does this value agree -- within the uncertainties --
                with the value you determined in Wednesday's class?
In case you need to refresh your memory,
When you are finished, place all your work in the folder. Staple together pages if needed. Make sure the names of all members are written on the work.
Copyright © Michael Richmond.
This work is licensed under a Creative Commons License.