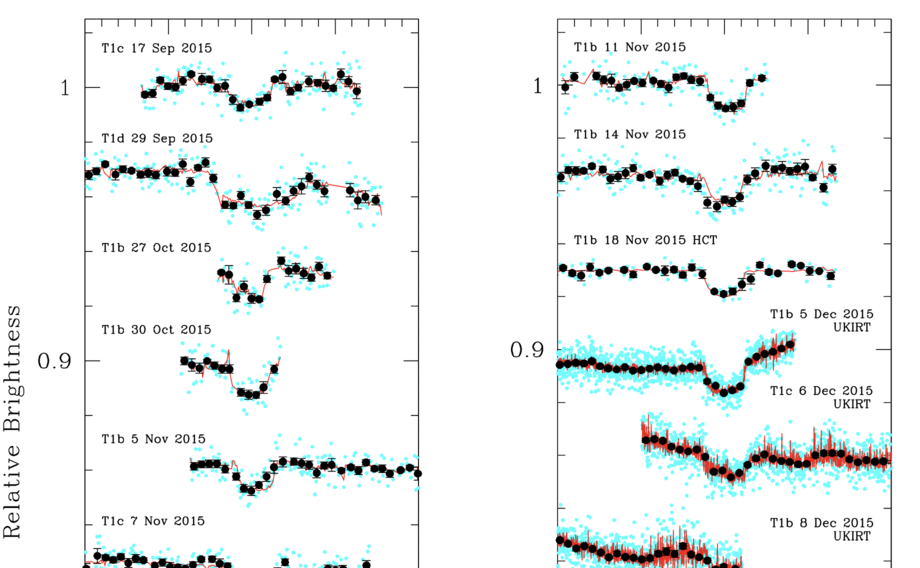
Taken from Extended Figure 1 of Gillon et al., Nature 533, 221 (2016)
 Copyright © Michael Richmond.
This work is licensed under a Creative Commons License.
Contents
In 2016, Gillon et al., Nature 533, 221 (2016) announced the discovery of a very interesting system with three exoplanets. As part of the TRAnsiting Planets and Planetesimals Small Telescope = TRAPPIST project, the group had been monitoring a large set of stars, looking for transits. Over the course of 62 nights in late 2015, the team noticed 11 transit-like events in the light curve of one particular star, now known as TRAPPIST-1.

Taken from Extended Figure 1 of
Gillon et al., Nature 533, 221 (2016)
Putting all the transits together, they were able to figure out that they had seen evidence for three planets in the system: two with definite periods (planets "b" and "c"), and one with too few transits to determine the period exactly ("d"). They immediately realized that this was a very interesting system to study, for several reasons:
Let's start with a very simple, basic lightcurve for a transit. What are the quantities we measure?
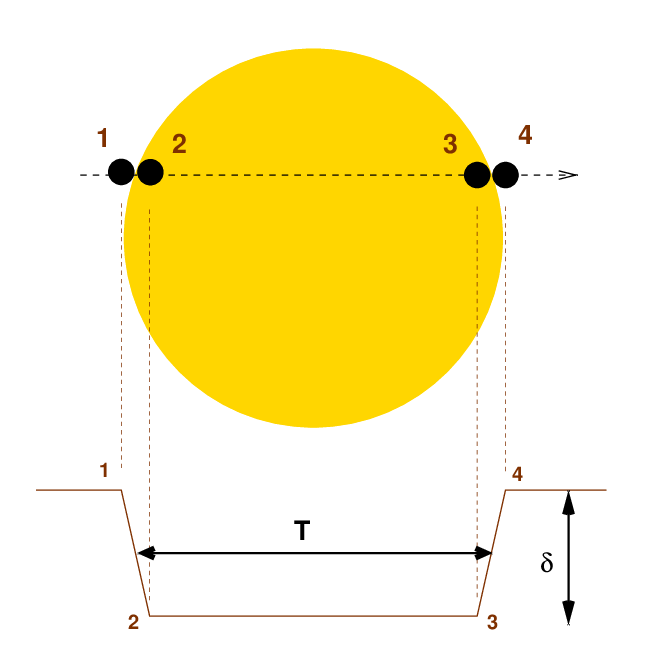
There are two quantities which are immediately obvious:
Oh, and there's one more which becomes available if you have patience:
   Q1:  What's the additional property one can
            determine from light curves of transits?
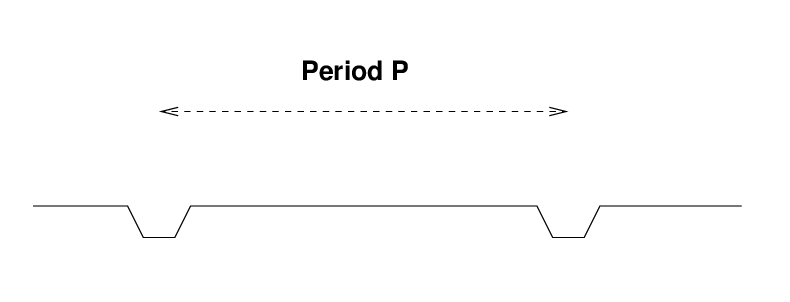
Now, these are only the obvious measureable quantities; if one has very high signal-to-noise ratio, one can learn additional things from the exact shape of the light curve during ingress and egress, and from the shape of the bottom of the light curve.
But, with these these three simple quantities, one can figure out a number of physical properties of the planet and its host star.
Given only the transit light curve observables
let's see what we can figure out about the host star, or its planet, or both. I'll assume that the orbit is circular and (probably) that the planet's mass is much smaller than its host star's mass.
The relative sizes of the host star and the planet are pretty obviously related to the depth.
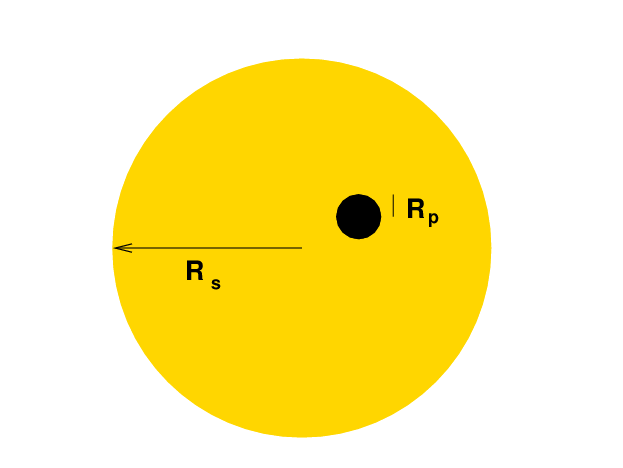
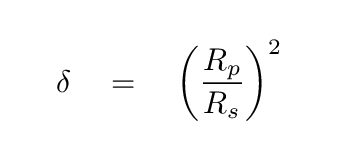
Please write down this equation -- you will need to use it soon.
This simple equation glosses over several minor complications; for the full story, see Winn's chapter in "Exoplanets".
Strange as it may seem at first, careful analysis of a transit signal alone can give us information about the density of the host star. In the case of TRAPPIST-1, this was of particular importance, as I will explain in a moment.
But first --- how does this work? The depth of the transit gives us one piece of information about the radius of the host star, Rs: its value relative to the radius of the planet.
If we compare the duration of the transit to the period of revolution, we can find a different ratio involving the radius of the host star.
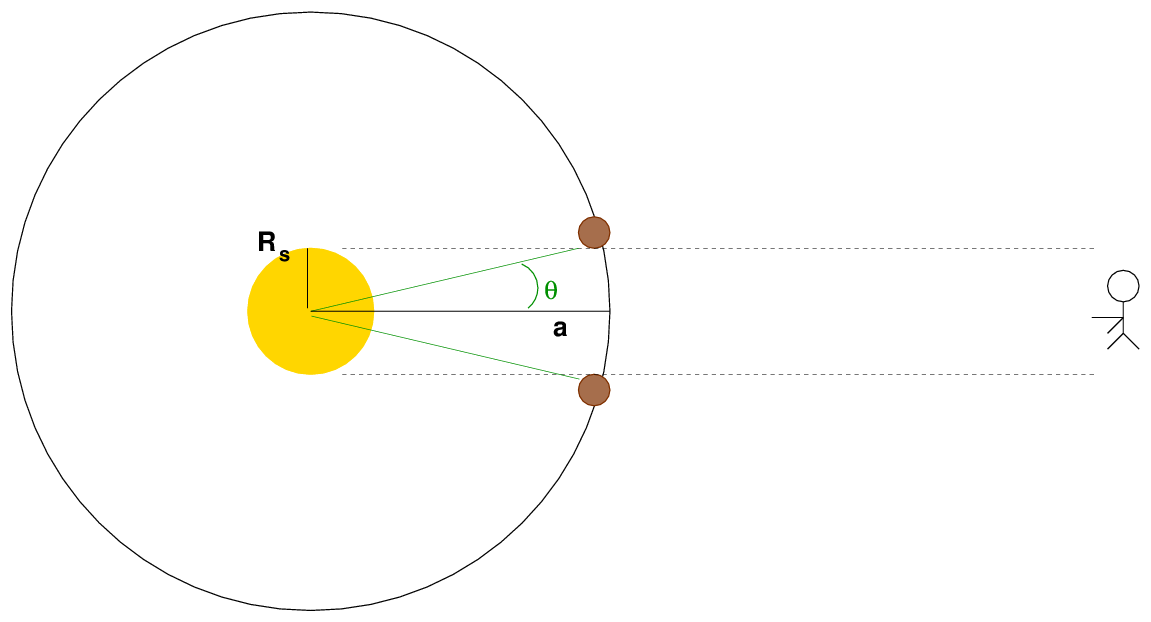
The angle θ shown above can be related to a ratio of distances, but also to a ratio of times.
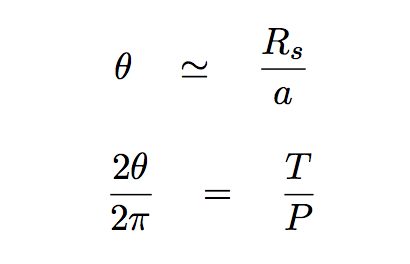
   Q:  Can you derive a connection between the observable times T, P
             and the (not observable) distances Rs, a?
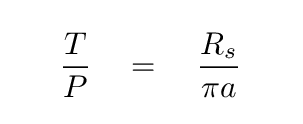
Now, if you take this ratio of stellar radius to orbital radius, and throw it together with Kepler's Third Law,

you can end up with an expression for the density of the host star in terms of the observables.
Q: Can you do it?


Now, I've made a number of simplifying assumptions, such as a circular orbit and zero inclination. But even if those are not true, one can place formal constraints on properties of the host star with a bit more work; see Winn's chapter in "Exoplanets".
Why is finding the density of the host star so important for the TRAPPIST-1 system? When the team first realized that they had 11 transit events, they started looking for patterns and periodicities. They found some -- assigning some transits to a candidate "b", and others to a candidate "c" -- but worried that with such small numbers of events, the apparent connections might simply be due to chance. In other words, they worried that their periods were spurious; perhaps there were 11 planets transiting in the system, creating 11 unrelated transits which just happened to recur at a few regular intervals.
But they also realized that IF the assignment of transits to planets "b" and "c" were correct, then the events for each of the two objects ought to yield THE SAME DENSITY for the host star, and that value ought to be close to the density expected for a star of spectral class M8. On the other hand, if the transits were just chance collections of unrelated events, the (spurious) periods would (very likely) not produce the same density for the host star; and even if they did, that spurious value would likely not be close to the value expected for an M8 dwarf.
So, what did Gillon et al. discover for their tentative assignment of transits to candidate exoplanets "b" and "c"?

Taken from
Gillon et al., Nature 533, 221 (2016)
So, to summarize, at the end of 2015, the TRAPPIST team knew that at least two, and probably three, planets were circling the star in this system. Based on the depth of the transits, they could determine the radius of each planet. The figure below, for example, shows two transits by planet "b", together with a best-fit model.
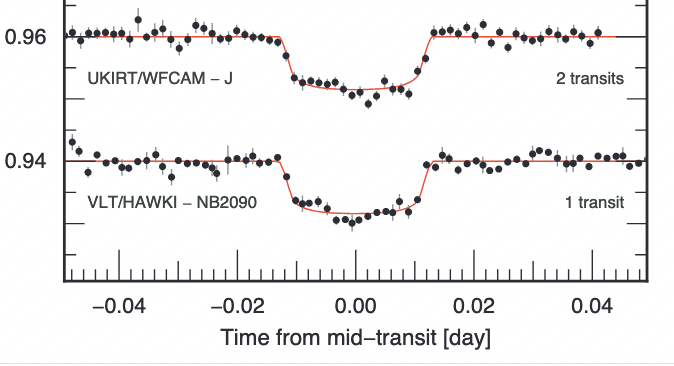
Figure 1 from
Gillon et al., Nature 533, 221 (2016)
   Q2:  What is the depth δ of these transits?


   Q3:  The radius of the host star is Rs = 8.3 x 10⁷ m.
              What is the radius of this planet?
Very interesting, indeed! Both planets turned out to be roughly the size of the Earth. All exoplanets are interesting, of course, but many people pay special attention to those which might be similar to our own planet.
So, the planets are roughly the SIZE of the Earth .... but are they also similar in MASS?
The most straightforward technique to determine the mass of an exoplanet is to look for the motion of its host star around their common center of mass. That motion can be detected via the Doppler shift of light emitted by the star.
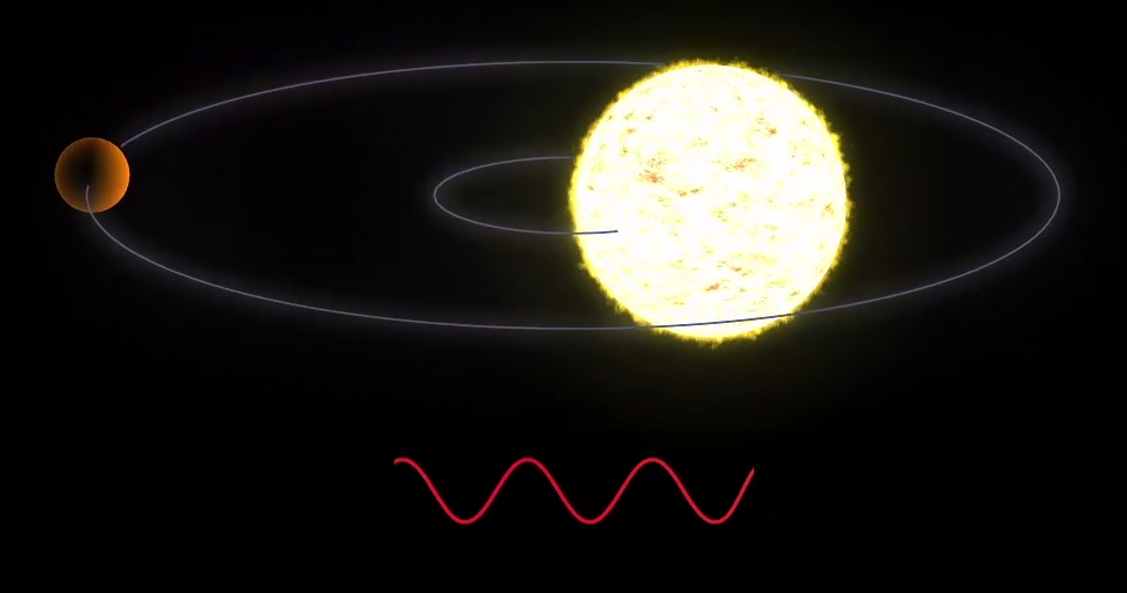
Image and movie courtesy of
NASA Exoplanet Exploration
Could we use this technique to find the mass of exoplanets in the TRAPPIST-1 system? Let's run a little test to find out if the method would be practical. Planet "b" has a period of P = 1.511 days. Based on its spectral type, the host star TRAPPIST-1 has a mass of about M* = 1.8 x 1029 kg. Using Kepler's Third Law, we can estimate the orbital radius of planet "b" to be roughly a = 0.0115 AU; assuming a circular orbit, it must move with a speed of roughly Vp = 83,000 m/s. As we saw earlier in this course, there is a simple relationship between the orbital speed of a planet and the reflex motion of its star:

  Q4:  Pretend that planet "b" has a mass equal to that of the Earth.
       Then we have

            Mp = 5.98 x 1024 kg
            Ms = 1.8  x 1029 kg
            Vp = 8.3  x 104 m/s

       How fast would the star TRAPPIST-1 move in response?
The answer is "not very fast." A speed of about 3 m/s is very difficult to detect, for two reasons.
The first difficulty is that it requires very, very careful calibration and observational procedures in order to make spectroscopic measurements with the required precision. Note how few exoplanets have been found via radial velocity methods at these small speeds:
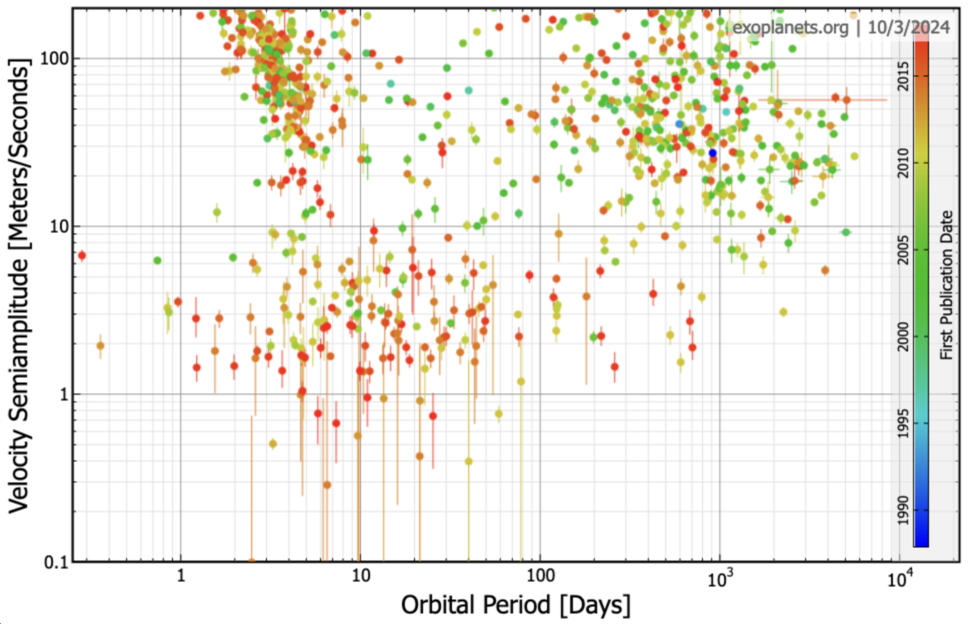
Graph created using the
exoplanets.org website
The second, and perhaps more intractable problem, is that the host star is an M8 red dwarf, and so it has a very active photosphere, with prominent starspots and large active regions.
Klein and Donati, MNRAS 488, 5114 (2019) examine the feasibility of detecting the radial velocity changes in TRAPPIST-1 due to its seven known planets. They conclude that it would be very difficult, since the size of radial velocity changes due to stellar activity are roughly the same size as the variations caused by the most dominant planets.
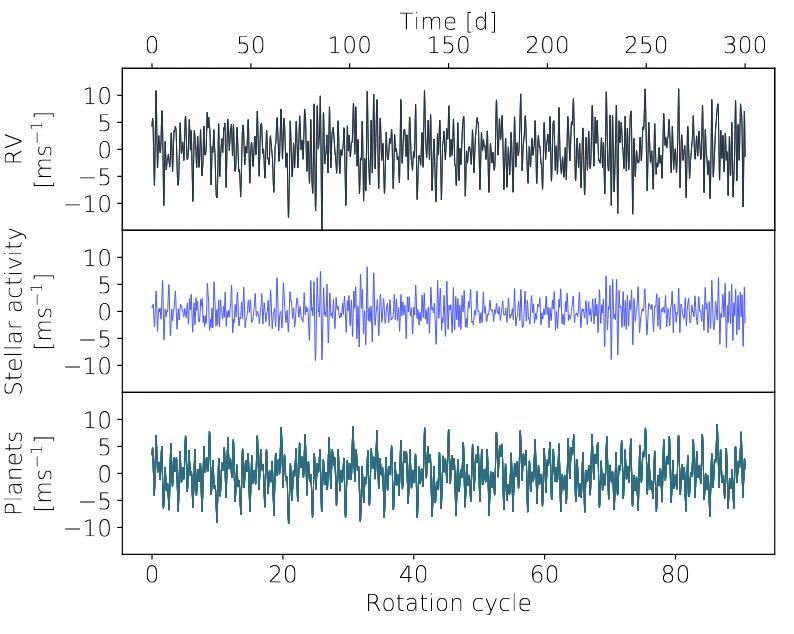
Figure 4 taken from
Klein and Donati, MNRAS 488, 5114 (2019)
So, we haven't been able to measure the masses of the planets in the TRAPPIST-1 system via the usual radial velocity technique (though there are recent hints that the situation may be changing.)
Over the next few years, a number of astronomers studied the TRAPPIST-1 system with many different telescopes, in both the optical and infrared, from the ground and from space. In particular, the Kepler K2 mission was able to observe many transits with photometry of high precision. Within two years of discovery, Grimm et al. (A&A 613, A68, 2018) were able to amass a collection of almost 300 transits for the system, of which nearly half were observed by Kepler. Using this large number of transits, astronomers were able to identify many more planets in the system: a total of SEVEN planets, not just two.
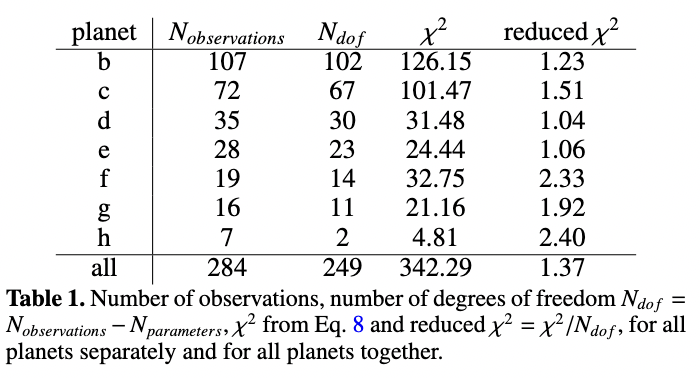
Table 1 from
Grimm et al., A&A 613, 68 (2018)
Five years after the discovery, Agol et al., PSJ 2, 1 (2021) had an even larger dataset to analyze:
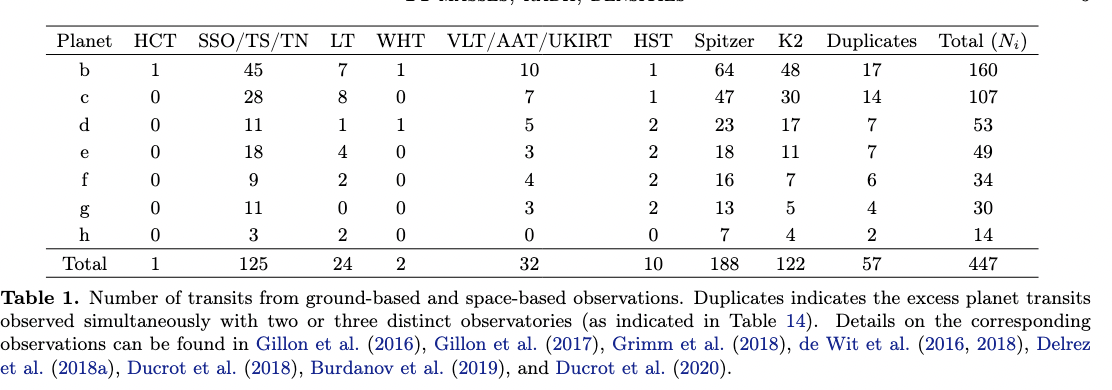
Table 1 from
Agol et al., PSJ 2, 1 (2021)
Why make so many measurements of transits? The point is to look for Transit Timing Variations (TTVs), due to the gravitational influence of one planet in the system on another. In order to explain TTVs, let me go back in time two centuries and tell the story of astronomers who were puzzled by a planet that wasn't quite where it should have been.
In the case of Uranus, astronomers used the small differences in POSITION between predictions and observations of a known planet to infer the position and mass of an unseen neighbor. But for TRAPPIST-1, the situation is a bit different, because we can't measure the positions of its planets directly. What we can do is to measure the TIME when each one passes between us and the host star.
A single, isolated planet orbiting its host star will follow a perfect elliptical orbit (ignoring very subtle effects such as gravitational radiation, tidal bulges, etc.). Its transits will occur at perfectly regular intervals which can be predicted easily into the future. Simple.
But in a multi-planet system, such as TRAPPIST-1, each object exerts gravitational forces on its neighbors. Because the planets are so much less massive than the star, their influence is much smaller, and each orbit is ALMOST a perfect ellipse; so the transits from each planet ALMOST occur at perfectly regular intervals. If one can make sufficiently precise measurements of the exact moment of the mid-point of each transit, however, one may note that some transits occur a bit earlier than predicted, and others a bit later. These small discrepancies from a simple, regular pattern are called Transit Timing Variations, or TTVs for short.
One might think that measuring the exact midpoint of a transit is a simple task, and it might be if one had perfect equipment in a noiseless environment. Unfortunately, as von Essen et al., arXiv:1607.03680 (2016) discuss in detail, light curves in the real world tend to be messy.
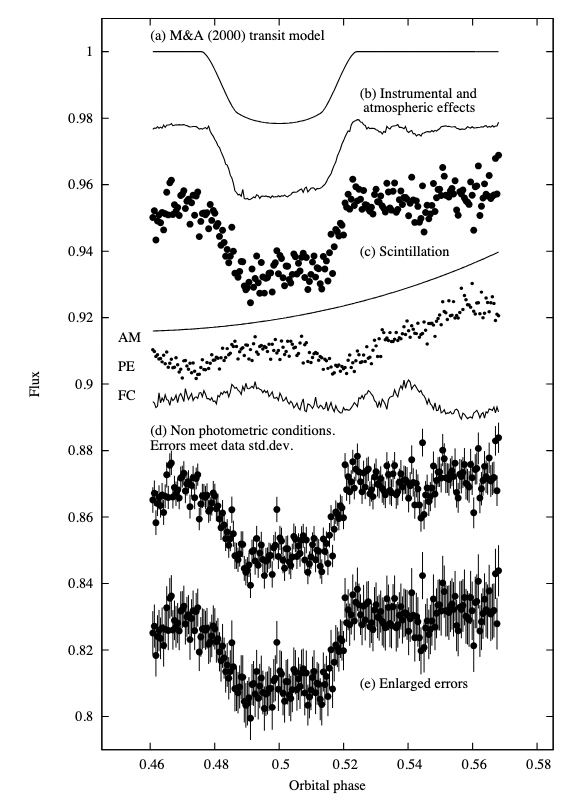
Figure 8 from
von Essen et al., arXiv:1607.03680 (2016)
Fortunately for astronomers, the planets in the TRAPPIST-1 system are all packed into a relatively small volume: their orbital radii range from 0.012 to 0.062 AU. With such small separations, the gravitational forces from one planet on its neighbors are large enough to produce changes in the time of transits which are pretty large:
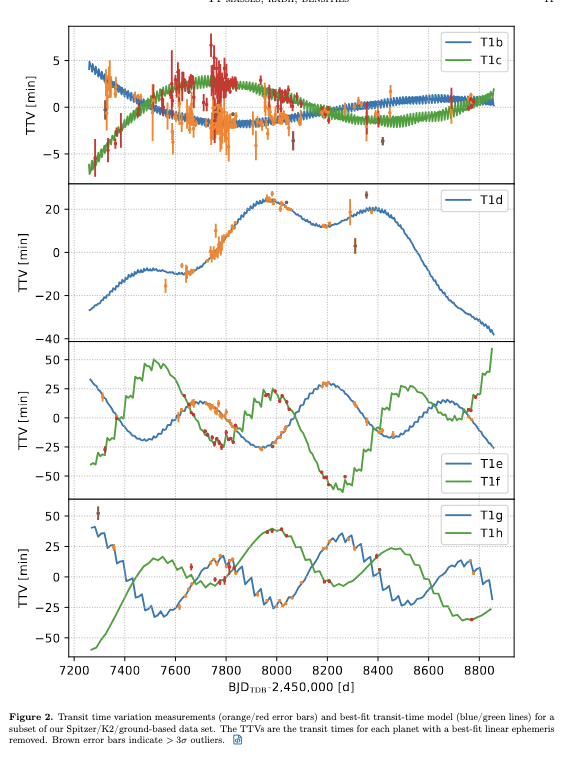
Figure 2 from
Agol et al., PSJ 2, 1 (2021)
    Q:  What is the amplitude of TTVs in transits for planet "c"?


    Q:  Look at the light curve of two transits below.  To what precision
              do you think you could determine the exact time of mid-transit?

Figure 1 from
Gillon et al., Nature 533, 221 (2016)
So, in the TRAPPIST-1 system, it is possible for us to determine the TTVs to a high enough precision that we can estimate the masses of the planets. It's a tough computational problem, yes, but it can be done.

Table 2 from
Agol et al., PSJ 2, 1 (2021)
Consider all that we can determine about the exoplanets in the TRAPPIST-1 system, based solely on photometric measurements of their transits (well, and some basic information about their host star as well):
But we're not done yet!
Since we know both the size and the mass of each planet, we can try to classify them. Astronomers typically divide planets into several categories with somewhat ill-defined boundaries.
So, can we place the TRAPPIST-1 exoplanets into one or more of these categories? A good way to start is by using the NASA Exoplanet Archive's Composite table and selecting exoplanets with good measurements of both radius and mass by requiring
If one makes a graph with planet mass on the x-axis (log scale) and planet radius on the y-axis (linear scale), then zooms into the low-mass corner, one will see something like this:
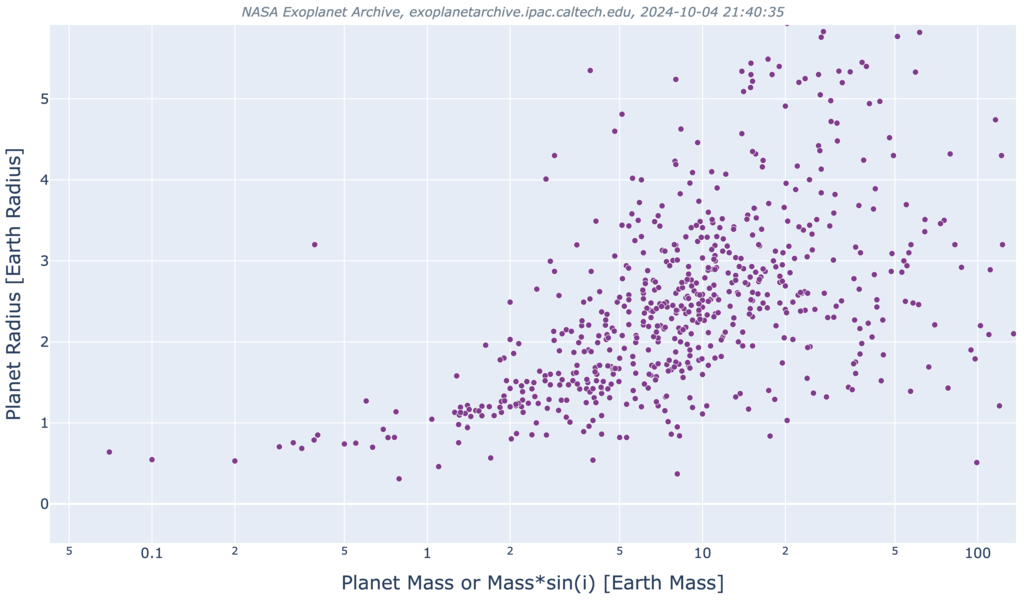
   Q:  Where does Earth lie on this graph?


   Q:  Where do the TRAPPIST-1 planets lie on this graph?


   Q:  How would you classify the TRAPPIST-1 planets?
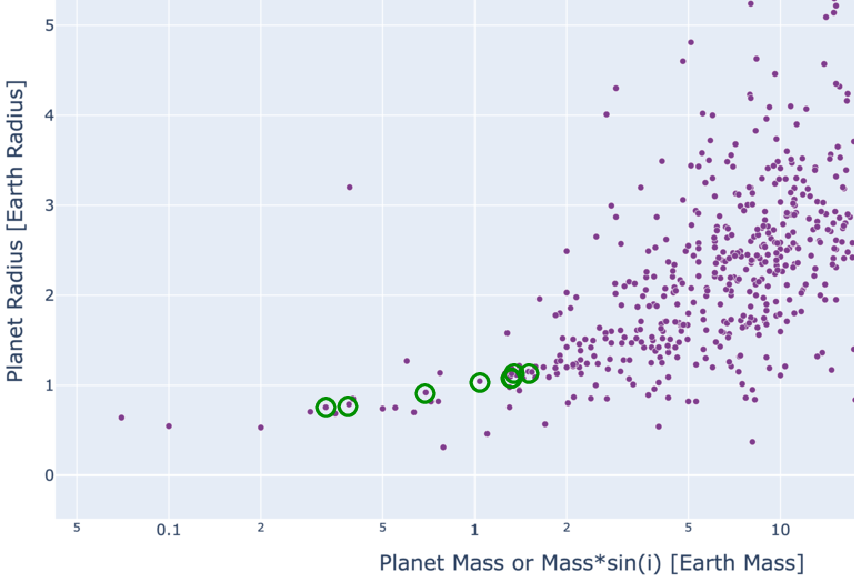
They are clearly members of the "terrestrial" group, which makes them especially interesting. One can find a nice table of their properties on Wikipedia.
But they might become even MORE interesting if they happened to have the right surface properties ....
All seven planets in the TRAPPIST-1 system appear to be terrestrial, with solid surfaces and surface gravities which would make them relatively comfortable for humans to stand and walk on them. Very nice. But -- what about their temperatures? Are they too hot? Too cold? Or ju-u-u-st right?

Still from "Bugs Bunny and the Three Bears",
courtesy of
IMDB and Warner Brothers
Computing the equilibrium temperature of a planet orbiting some host star isn't too difficult, if one makes some simplifying assumptions:
With these assumptions, all we need to know to compute the equilibrium temperature are two items: the host star's luminosity L, and the orbital radius of the exoplanet a. By equating the incoming flux of energy striking the illuminated half of the planet to the outgoing flux of blackbody radiation from its entire surface, one can derive the following expression for its temperature:

      The luminosity of TRAPPIST-1 is   L  =  2.12 x 10²³ W


    Planet          orbital radius a         equilibrium temperature
                        (meters)                     (K)
    -----------------------------------------------------------------
       b                 1.73 x 10⁹
       c                 2.36 x 10⁹

       d                 3.33 x 10⁹
       e                 4.38 x 10⁹

       f                 5.76 x 10⁹
       g                 7.01 x 10⁹

       h                 9.26 x 10⁹
    -----------------------------------------------------------------
Aha! Planet "d" is certainly in the "Goldilocks" or "habitable" zone, based on its equilibrium temperature. Planets "c" and "e" might qualify as well, especially if they should have atmospheres which might mollify the conditions, at least in some regions.
If one is interested in writing science-fiction stories in which human explorers travel to known star systems, it seems that TRAPPIST-1 would be a very good setting! In fact, it already has.
Since there are a number of Earth-like planets in the TRAPPIST-1 system, some of which may have Earth-like conditions, astronomers would like to learn more about them. One big question is do the planets have atmospheres?
One way to answer that question is to make careful measurements of the spectrum of the host star as a planet passes in front of it. In theory, if the planet does have an atmosphere, some of the starlight will pass through it, imprinting features into the spectrum which appear only during the transit. This technique is called transmission spectroscopy.
It is very difficult, for a number of reasons, but those who specialize in this technique have noticed that the members of the TRAPPIST-1 system -- due to a combination of the small size of their host star and the moderate temperature at their locations -- ought to produce particularly strong signals.
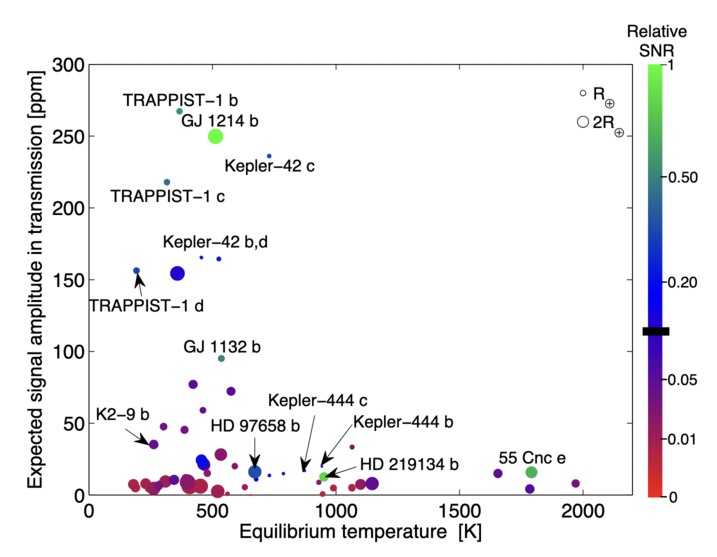
Figure 3 of
Gillon et al., Nature 533, 221 (2016)
Next time, we'll look in depth at the technique of transmission spectroscopy, and see if observations of the planets in TRAPPIST-1 have uncovered any evidence for atmospheres.
 Copyright © Michael Richmond.
This work is licensed under a Creative Commons License.