 Copyright © Michael Richmond.
This work is licensed under a Creative Commons License.
Transmission spectroscopy
Michael Richmond
Oct 11, 2024
One of the most exciting developments in exoplanet
science over the past decade has been
the search for evidence of, and analysis of,
exoplanetary atmospheres.
As usual,
we humans tend to find a new world more interesting
if there's a chance that we might be able (eventually) to visit
it comfortably.
In addition, astronomers looking for signs of alien
life on other planets naturally suspect that
planets with atmospheres are the best places to look;
and planets with Earth-like atmospheres might be best of all.
Let's look into some of the basic physical principles that
place limits on our ability to find and characterize the
atmospheres around other planets.
Contents
Should we use optical telescopes, or radio telescopes -- or X-ray telescopes?
Which instruments are most likely to reveal
the existence of gaseous atmospheres around
exoplanets?
One can answer this question in several ways:
- at which wavelengths is it easy, or even possible,
to detect the light from exoplanets?
- at which wavelengths is the background noise
particularly small, allowing us to detect weak
signals?
- where are the typical components of exoplanetary atmospheres
most likely to produce strong signatures?
The best choice, of course, will be some wavelength regime
in which there are plenty of strong markers of atmospheric
gases,
AND
the background is relatively low,
AND
in which we can observe efficiently and without great expense.
Let's consider each of these constraints in turn.
- observing windows
-
In theory, we could seek emission from atmospheric gases
at any wavelength across the electromagnetic spectrum,
from gamma rays to radio waves.
Perhaps astronomers will do so at some point in the future.
But at the present time, we are focusing our efforts
on phenomena which occur during planetary transits --
when a planet passes in front of its host star.
During a transit, some of the star's light will pass through
the planet's atmosphere, causing (we hope) absorption
features to appear in its spectrum.
So, the first criterion we can choose is simple:
pick a wavelength at which the star emits a lot of light.
If we can detect many photons, we can achieve high signal-to-noise
ratios, allowing us to pick out very weak signals.
For typical main-sequence stars,
this limits us to
the near-UV, visible, and near-IR.
A space-based telescope can make measurements at any of these
wavelengths.
If we wish to search from the ground, however, we are limited
to those wavelengths which are transmitted by the Earth's
atmosphere.
Yes, yes, observing from the ground
means that we'll also see absorption due to gases
in the Earth's atmosphere, which can complicate
the search for exoplanetary features.
As we shall see, there are some ways to avoid
confusing terrestrial and extra-terrestrial lines.
The graph below shows the transmission of light through
the Earth's atmosphere in the UV-visible-IR region.
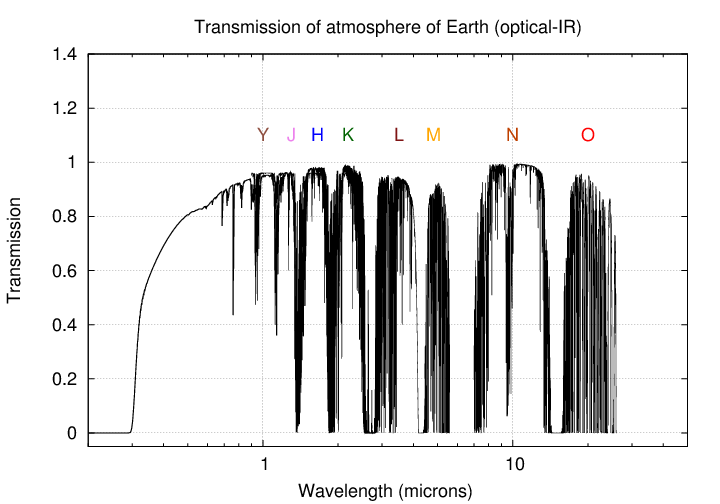
One can see that our choices for ground-based observations
include the entire visible range (from about 0.4 to 0.8 microns),
plus a series of windows in the near-infrared.
The strong absorption bands separating the windows are
largely due to water vapor,
so using a telescope in a dry site
(at high altitude or in the Antarctic)
can yield better results.
At wavelengths beyond 5 microns or so, thermal emission
from the atmosphere, the telescope, and the surrounding
landscape starts to become a major source of noise.
By this criterion,
our choices are
UV-visible-IR for space-based telescopes,
but limited to certain windows within the
visible and near-IR (0.4 to 5 microns or so)
for ground-based telescopes.
- background levels
-
When we point a telescope at some exoplanetary system,
we collect not only light from the objects of interest --
host star and transiting planet --
but also radiation from other material:
atoms and molecules in the Earth's atmosphere,
dust in the solar system and the interstellar medium,
and other stars and celestial objects in the line of sight.
We can lump together the photons from all these other
sources and refer to them as "background."
The higher the level of these background sources,
the harder it will be for us to separate and measure
the light from the objects of interest.
Therefore, we ought to plan our observations
in a region of the spectrum where the background levels
are relatively low.
In order to illustrate the issue, let's consider three
passbands in the visible and IR: B, K, and N.
I'll choose numbers from
Leinert et al., A&AS, 127, 1 (1998)
and
Expected NIR sky background at the TAO site.
- B-band: this optical passband is centered
around 0.44 microns. The background level
in the optical is often measured in magnitudes
per square arcsecond. From a dark site on the
Earth's surface, the B-band background
is roughly 23 mag/sq.arcsec.
To compare with the levels at other wavelengths,
we can convert this to the number of photons
per second per square arcsecond per square meter
of collecting area. In those units,
the B-band background is roughly

- K-band: this near-IR passband is centered
around 2.2 microns. The background level
in this band also depends on the observing site,
of course. It is sometimes measured in the same
units as in the optical, at about 13 magnitudes per square
arcsecond at a dark site,
and sometimes described in terms of
Janskys per square arcsecond (roughly 0.004 Jy/sq.arcsec
at a good site).
If we convert to a photon-based measure,

- N-band: this mid-IR passband is centered
around 11 microns. At this wavelength,
the atmosphere, the landscape, buildings, and
telescopes all emit thermal radiation,
causing background levels to increase sharply.
The value depends strongly on temperature and
atmospheric properties, but measurements from
the site of TAO in the Atacama Desert show
representative values of

For ground-based observations, the results are clear:
one must avoid thermal emission by working in the optical
or near-IR regime.
Space-based telescopes don't have to deal with the emission
of light from the Earth's atmosphere or surface,
but they aren't immune from thermal radiation.
Dust particles in the solar system, which are concentated
toward the plane of planetary orbits,
absorb light from the Sun and re-emit it at longer
wavelengths.
This zodical light creates a background which
rises at longer IR wavelengths, but to a lesser extent.
Using values from
Leinert et al., A&AS, 127, 1 (1998),
we find that in space,
| band |
B |
K |
N |
| photon/s · m2 · □'' |
10 |
26 |
2600 |
Whether working from the ground or space, one should
-- if possible --
avoid the longer infrared wavelengths in order to keep
the background levels from overwhelming the signals from
exoplanetary atmospheres.
- locations of strong atmospheric features
-
Where do we expect to find strong absorption features in the
spectrum of an exoplanet? Well, let's consider the mechanisms
by which gases can absorb light.
- electronic transitions:
Atoms and single atomic ions have a set of
electronic energy levels. An atom may absorb a photon
by jumping from a lower to a higher energy level.
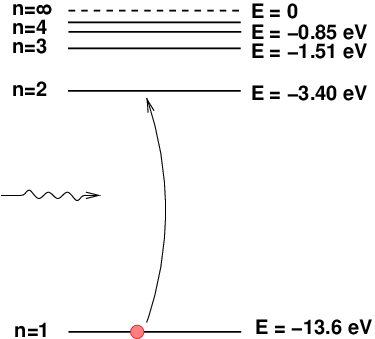
For example, a hydrogen atom has levels given by
a simple formula,

The difference between the n = 1 and n = 2
levels is 10.2 eV, so if a photon with this energy
(corresponding to a wavelength of 1216 Angstroms)
passes an atom in the ground state, the atom may absorb
the photon and enter a higher energy level.
               Q:  In which portion of the electromagnetic spectrum
                      do we find a photon with energy of 10.2 eV?
However, there are two reasons that electronic transitions
are not particularly good choices for exoplanets.
First, at the temperatures expected in most planetary
atmospheres (≤ 1500 K), most species will be in
molecular, not atomic, form. Second, the energies
required to raise most common atoms (H, He, C, O, etc.)
out of their ground states are considerably larger than
the typical kinetic energies of particles in planetary
atmospheres. So, for the most part, we can
ignore these lines.
- vibrational transitions:
When atoms combine into molecules, new forms
of energetic states appear.
One of these involves vibrations of the bond
between the atoms.
For example, the oxygen and carbon atoms in a CO
molecule can be treated as a pair of point masses
connected by an ideal spring of some force constant k.
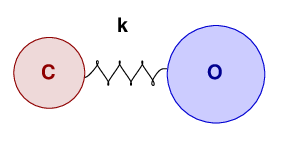
In this case, the force constant has a value of roughly
k = 1900 N/m. Treating the molecule as
a simple harmonic oscillator,
one can compute the energy of its vibrational states,
and therefore the energy of the transitions between them.
For CO, the energy required to raise the molecule from
the ground state to the first excited vibrational state
is about 0.26 eV, corresponding to a wavelength of
about 4.7 microns.
Other simple molecules of interest to exoplanet researchers,
such as H2O or NH3,
have vibrational states with similar transition energies.
Now, the typical kinetic energy of particles in a gas
is of order

At temperatures of a few hundred to a thousand Kelvin,
this kinetic energy is somewhat smaller than the
energy of the first excited vibrational state.
We may therefore expect many of the molecules to be in
the ground state, ready to absorb near-IR photons
and imprint an absorption line into the spectrum
of the host star.
If we consider all these factors --
the wavelengths at which we can observe celestial sources clearly,
at which the background levels are low,
and
at which the constituents of exoplanetary atmospheres
are most likely to absorb light --
the conclusion is clear:
our best choice is to look in the
near-infrared,
at wavelengths between, perhaps, 1 and 5 microns.
Looking for evidence for absoption of light by the
atmosphere of an exoplanet is a complex process.
It will help if we break it down into a series
of steps,
starting with a much simpler procedure
and working our way up to the final result.
So, let's begin with a problem which is easier to
describe and to understand:
detecting the transit of a planet in front of its host star.
Keep in mind that in order to be SURE that we've
seen an event, we need to verify that two things are true:
- we see a dip in the brightness of the host star, AND
- the size of that dip is larger than the uncertainty in the
measurement of its brightness
The proper calculation of the uncertainty in a photometric
(or spectroscopic) measurement is, itself, a rather
complicated issue.
I'll take a very simple approach, and assume
that the only source of noise in the measurement
is Poisson noise ("shot noise") in the number of photons
collected from the host star.
In that case, if we collect N photons in a measurement,
then the uncertainty in that number is √N,
and the fractional uncertainty is

For this example, let's consider a rather favorable
system to study:
a Sun-like star at a distance of just d = 10 pc.
We will observe this star in the near-IR;
let's pick the H-band,
centered at
λ0 = 1.66 microns
and with a width of
Δλ = 0.251 microns
(according to
Cohen, Wheaton, and Megaeath, AJ, 126, 1090 (2003)).
The apparent magnitude of this star at
a distance of 10 pc will be, by definition,
the absolute magnitude of the Sun;
according to the tables in
Willmer, C. N. A., ApJS 236, 47 (2018),
this is
mH = 3.3.
Going through the calculations,
we find that the flux of photons from this
star will be

Let's adopt a relatively modest telescope as our instrument
one with a diameter D = 1 meter = 100 cm.
The collecting area is just π (D/2)2.
If we observe this star under ordinary circumstances,
when no planet is blocking any of its light,
and take a single 1-second exposure,
how many photons can we expect to collect?
  Q:  How many photons will we collect in 1 second?

  Q:  What will the fractional uncertainty of our measurement be?
My answers.
Now, suppose that an airless, solid planet
passes in front of the star.
During the transit, it will block a small amount of the
star's light.
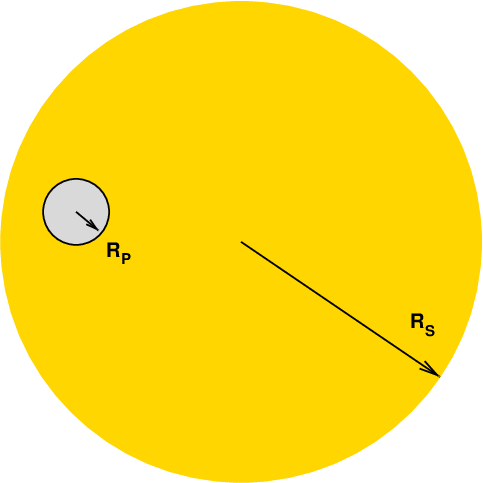
Consider two cases:
an Earth-like planet, or a Jupiter-like planet.
In each case, how much light will the planet block?
Will we be able to detect the small decrease in the star's brightness?
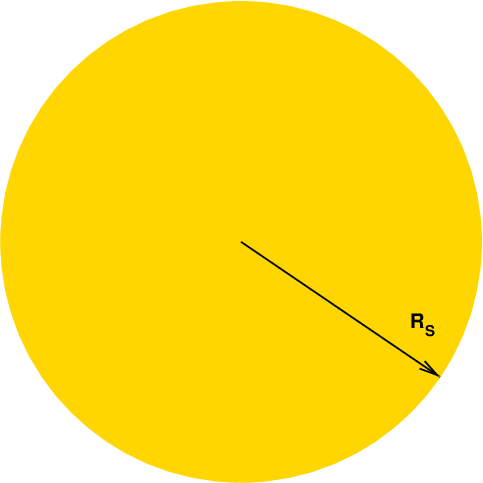
     Stellar radius   Rs = 6.96 x 10⁸ meters.


                          Earth            Jupiter
----------------------------------------------------------
 radius (m)             6.37 x 10⁶         7.15 x 10⁷

 fraction blocked

 is dip significant?

----------------------------------------------------------
Hmmm. In this case,
the numbers show that we should be able to detect
the transit of a Jupiter-sized planet easily:
the fraction of light it blocks is much larger
than the fractional uncertainty in a measurement with a one-second exposure.
But that's not true for the Earth-sized planet.
In that case, the fractional uncertainty is LARGER
than the size of the decrease in brightness.
Fortunately, there's a simple change we can make
to our experiment which will allow us to detect
the planet:
we can increase the exposure time,
collecting more photons, increasing the precision
of the measurement.
For example,
if we increase the exposure time from 1 second to 100 seconds,
then the number of photons we collect rises by
a factor of 100,
and the fractional uncertainty decreases by a factor of √(100) = 10.
With the longer exposure,
the fractional uncertainty would shrink to about
1 x 10⁻⁵,
considerably smaller than the change in the star's brightness.
An airless planet crossing the disk of a star
is simple -- and boring.
Let's add an atmosphere,
of height h.
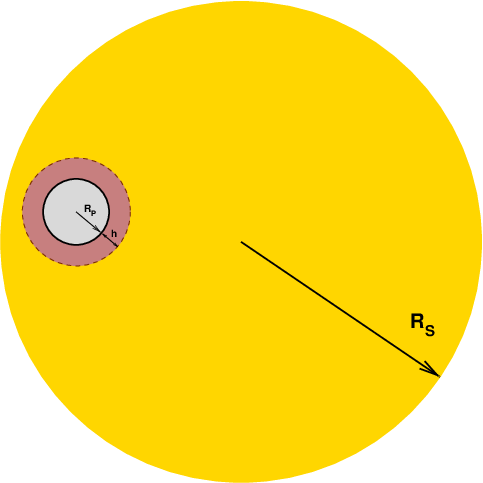
If the atmosphere is opaque, then the amount of light
blocked during a transit is now larger:

If the atmospheric thickness is considerably smaller than
the solid body of the planet,
then one can approximate the fractional increase in the
depth of the transit as

     Stellar radius   Rs = 6.96 x 10⁸ meters.


                                    Earth
----------------------------------------------------------
 radius (m)                       6.37 x 10⁶

 atmospheric height h (m)         8.0  x 103

 fraction blocked
  if atmosphere opaque
----------------------------------------------------------
Note that in this case,
adding an atmosphere causes only a very small increase
in the depth of the transit.
Now, let's see how we can use an absorption line
to reveal the presence of an atmosphere,
using a photometric approach.
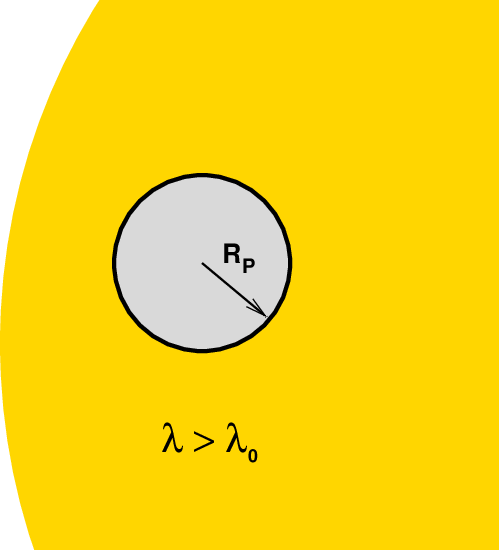
Suppose that a planet does have an atmosphere,
and it contains some gas with a strong absorption
line at a wavelength λ0.
If we make measurements of the host star
during a transit through three filters at
slightly different wavelengths,
- λ < λ0
outside the line at shorter wavelengths
- λ = λ0
inside the line
- λ > λ0
outside the line at longer wavelengths
then our instruments will record a smaller depth of transit
through the two "outer" filters,
compared to the measurement through the central filter.
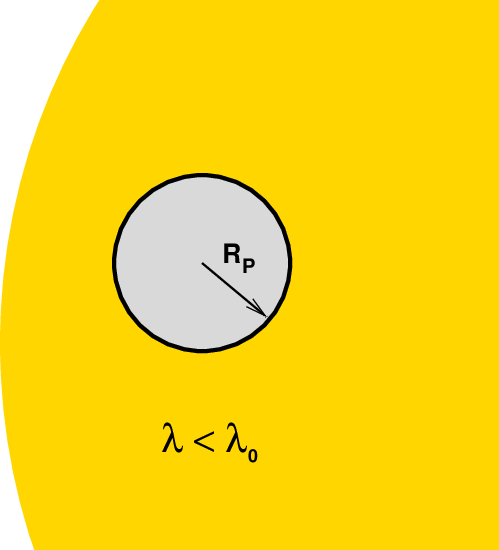
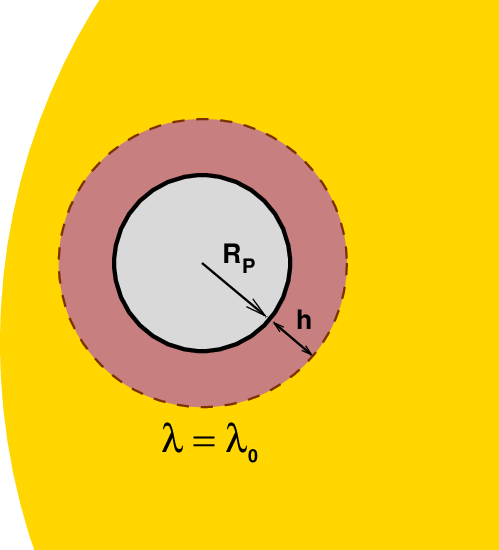
To continue our earlier example,
suppose that we observe an Earth-like planet with an Earth-like
atmosphere transiting a Sun-like star,
using a telescope of diameter D = 1 m.
Let's make measurements at wavelengths within the
H-band,
choosing narrow filters
which are centered on some wavelength at which
the atmosphere has a strong absorption line.
For example, suppose that the material absorbs
at
λ0 = 1.660 microns,
and the line extends across the entire
(unrealistically wide)
100-Å span from 1.655 to 1.665 microns.
We choose filters
of the same width,
Δλ = 0.010 micron = 100 Å,
one at shorter and one at longer wavelengths:
                     off-line            on-line             off-line
band (microns)    1.630 - 1.640        1.655 - 1.665       1.680 - 1.690
-------------------------------------------------------------------------
star (photon/s)    3.51  x 106           3.51  x 106          3.51  x 106

frac blocked       8.376 x 10⁻⁵          8.398 x 10⁻⁵         8.376 x 10⁻⁵

measure (photon/s)   3,509,706           3,509,705.2          3,509,706
-------------------------------------------------------------------------
The difference between the measurement inside the line
and outside the line is small -- very small.
For these parameters, we expect to see a difference
of just about 1 fewer photon per second collected through
the "on-line" filter than the "off-line" filters.
If we expose for just a single second,
then we collect roughly 3.5 million photons
through each of the filters.
The uncertainty in the measurement throigh each
filter is (due to Poisson noise only)
the square root of that number, or about ± 1870
photons.
Yikes! There's no way we can detect a change of just
1 photon when the uncertainty in each measurement
is almost 2000 photons.
This particular experiment will utterly fail to detect
the presence of an atmosphere on the planet,
if it exists.
But if the planet is larger,
and has a more extensive atmosphere,
perhaps there is a chance.
Let's pick a real system --
HD 209458 --
which has a star roughly the size
of the Sun, but a much larger
planet;
and we'll assign this planet a very thick atmosphere,
so that it blocks a much larger amount of light.
The estimate of h in the table
below is based on the method of
Sing et al., Nature, 529, 59 (2016).
     Stellar radius   Rs = 8.35 x 10⁸ meters.


                                    HD 209458 b
----------------------------------------------------------
 radius (m)                       9.937 x 10⁷

 atmospheric height h (m)         5.7   x 105

 fraction blocked
  if atmosphere transparent       0.01416

 fraction blocked
  if atmosphere opaque            0.01433

 difference in fraction           0.00016
   blocked
----------------------------------------------------------
Aha! The fractional difference between the on-line and off-line
measurement is much larger.
That means that we don't have to collect trillions
of photons in order to detect reliably the difference
between the on- and off-filter values,
and so prove the presence of an atmosphere.
In the general case of a star with radius RS,
planet with solid body radius RP,
and planetary atmosphere of height h,
one can derive an expression for the
change in depth of transit between filters which do and do not
contain the absorption line.
As long as the atmosphere is considerably smaller
than the solid body of the planet,
h << RP,

Even for favorable cases like the one
involving HD 209458,
it is necessary to collect
a large number of photons in order
for the Poisson noise in the measurement
to be smaller than the fractional change
between in-line and out-of-line values.
Since the fractional error due to
Poisson noise is proportional to the
square root of the number of photons collected,
we can make a rough estimate
of the number of photons N required
to detect some particular change-in-depth-of-transit:


If some particular combination of observing
parameters does not yield a large enough number
of photons,
one can modify the setup in several ways to increase
the signal:
- increase the telescope diameter D.
Straightforward, but expensive.
- increase the exposure time.
However, there is a limit to this approach:
typical exoplanetary transits last a few hours,
so the exposure times can't be longer than
an hour or so.
There's another complication in the detection of
planetary atmospheres
which involves several factors,
but boils down the fact that the
observed wavelength of the absorption lines
will change significantly over the course of the
transit.
Why is this important?
Remember, the key to detecting an atmosphere
is detecting the CONTRAST between
the brightness of the host star at wavelengths
inside the line and outside the line.
In order to maximize the difference
between the in-line and out-of-line
measurements,
we should choose our filter bandwidths
carefully.
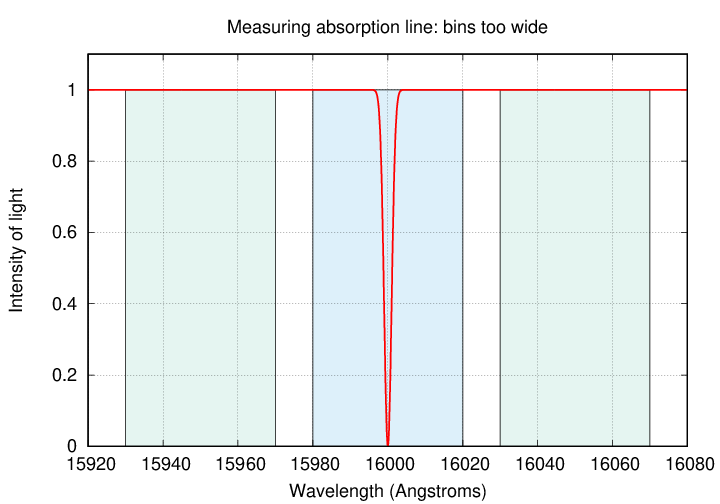
Consider an absorption feature at 1.66 microns = 16,000 Å,
with a width of about 4 Å.
If we choose filters much wider than the line width,
we'll include lots of light from outside the line itself
in the "in-line" filter.
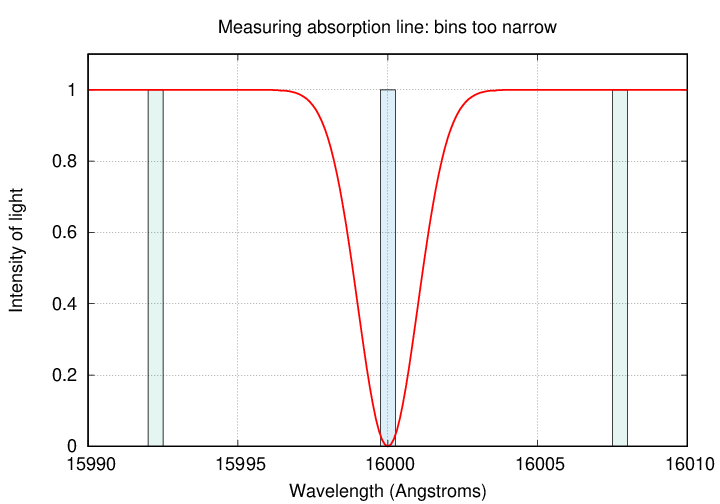
On the other hand,
if our filters are too narrow,
the "off-line" measurements won't include as many photons
as they might,
leading to larger Poisson noise.
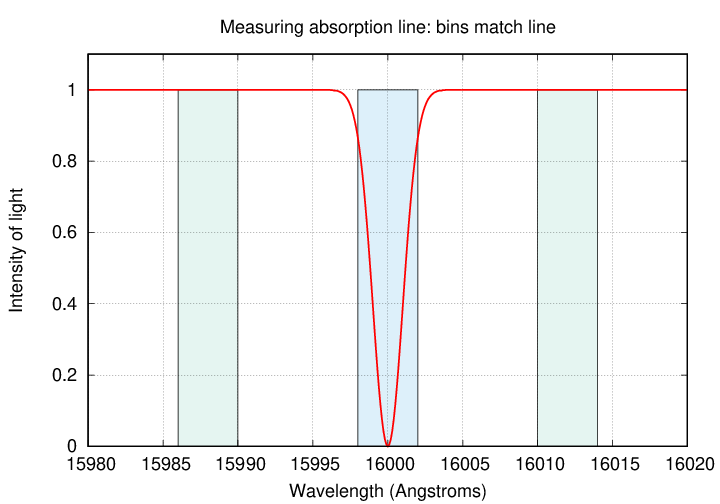
To optimize the detection of the absorption line,
our filters should have bandpasses roughly equal
to the width of the line.
Just how wide are typical absorption lines in exoplanetary
atmospheres?
This is a complicated question,
as there are a number of factors which influence
the shapes of the lines.
- Doppler broadening turns out not to be very
important. The speed of a CO molecule
at T = 300 Kelvin is about 500 m/s,
which leads to a Doppler shift of about 0.03 Å.
Even on hot Jupiters,
with temperatures of T = 1500 K,
this effect only amounts to about 0.06 Å.
- Line saturation depends on the number of molecules
along the line of sight, but can lead to widths
of several tenths of an Å.
- Pressure broadening can also be important, especially
in the lower regions of an atmosphere.
For general purposes,
I'll adopt a generic line width
of
Δλ = 0.3 Å
for the following discussion,
consistent with measurements
of O2 molecular lines
in the Earth's atmosphere
(
van der Riet Wooley, ApJ 73, 185 (1931) ).
Okay, having adopted this line width,
one might guess that measurements would be
straightforward:
choose a pair of narrow-band filters
or spectroscopic regions
roughly
0.3 Å
wide, on-line and off-line,
then make a series of exposures
over the course of many hours,
extending from before the transit
(to establish a baseline)
to some time after the transit
(to check the baseline).
Simple, right?
Wrong!
Unfortunately, there's a complication:
the wavelength of the absorption line will
change significantly over the course of the transit.
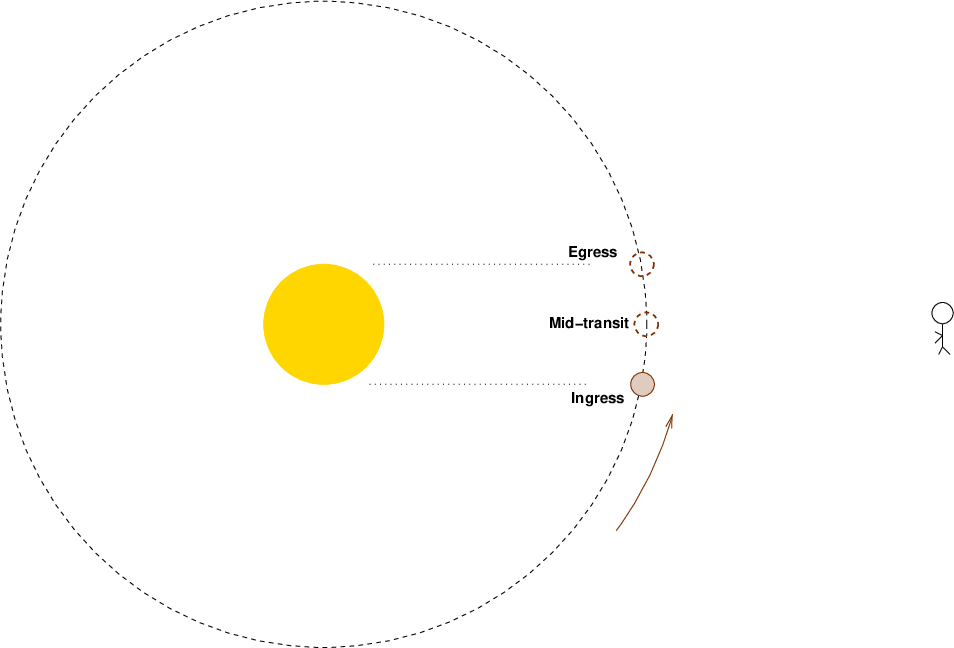
Consider the diagram below,
which shows the position of the planet in its orbit
at the start, middle, and end of the transit.
To make the effect of the orbital motion more easily seen,
I've exaggerated the size of the star relative
to the orbit in the following diagrams.
At the start of the transit, the planet is moving
toward the observer.
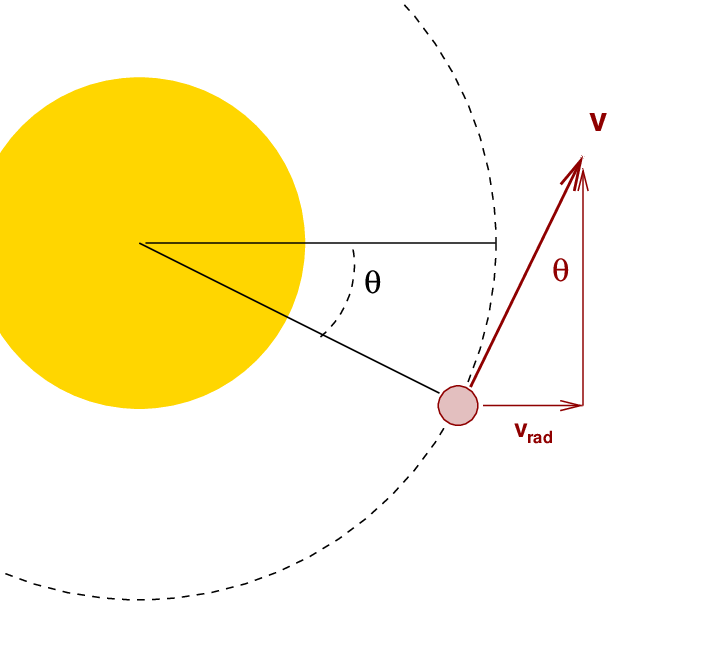
   Q:  Write an expression for the radial velocity
           in terms of v and θ.
Okay, but just what is the angle
θ
at the start (and end) of the transit?
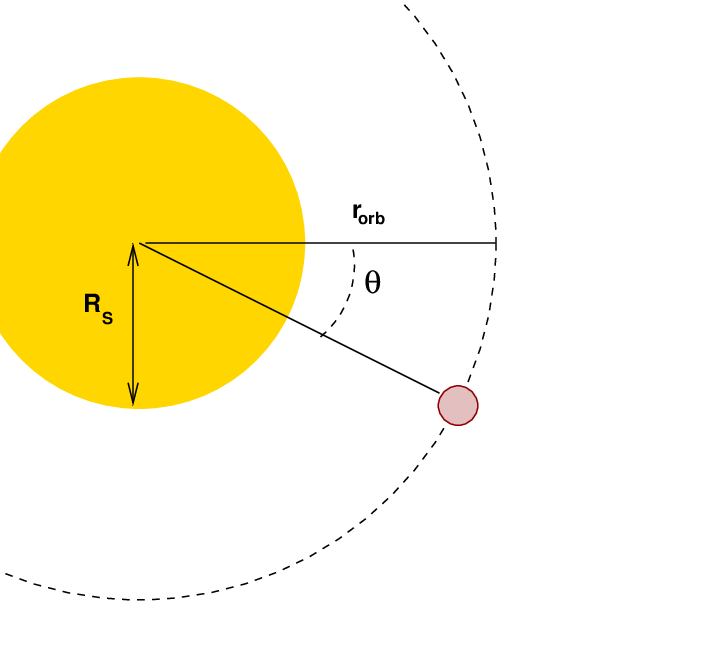
The magnitude of the radial velocity at ingress (or egress)
can be expressed as

That radial velocity, in turn,
generates a Doppler shift which can change the
observed wavelength of the line itself.

In some cases, this shift can be considerably larger
than the width of the line.
For example,
in the case of
HD 209458b,
      RS  =  8.35 x 10⁸  m

      rorb = 6.96 x 10⁹  m

      v0  =  1.43 x 10⁵  m/s


   Q:  For an absorption feature with rest wavelength λ0 = 1.660 microns = 16,600 Å
             what is the shift in wavelength from ingress to egress?
My answer
Recall that the typical width of absorption lines in an
exoplanet's atmosphere may be 0.2 or 0.3 Å.
This Doppler shift due to orbital motion
can cause the line to move by many times its width,
complicating the analysis of observations.
Blain et al., arXiv 2408.13536 (2024)
made a model of the spectrum they expected to
observe over the course of a transit by
HD 209458b.
One panel from Figure 5 of their paper
(slightly modified)
is shown below.
In this two-dimensional graph,
wavelength runs left to right, in the usual manner,
but the vertical direction indicates time,
running from bottom to top.
The purple section of the graph corresponds to the duration
of the transit.
In that section,
features due to the photosphere of the star are
shown in white; they remain at the same wavelength at all times.
But the features caused by absorption in the exoplanet's
atmosphere, shown in dark purple,
shift from shorter to longer wavelengths
over the course of the transit.

A heaily modified version of Figure 5 from
Blain et al., arXiv 2408.13536 (2024)
To summarize,
one who tries to study the atmosphere
of an exoplanet faces quite a few challenges:
- one must choose a proper wavelength regime,
balancing the ability to collect photons from
distant targets with the need for low background levels
- one must identify one (or more) absorption lines
in this range of wavelengths
which ought to be produced strongly by the
atmosphere of the target planet
- one must choose a span of wavelengths over which
to collect photons,
roughly the width of the absorption features of interest,
and reaching out to longer and shorter wavelengths
in order to determine a continuum level accurately
- one must account in the reductions
for the shifting location of the
planetary lines over the course of a transit
And, of course, one more very important criterion
- one must collect enough photons to detect the
very very small change in brightness between
the planetary lines and the neighboring continuum
This last factor can place a stringent requirement
on the size of the telescope used to perform
this experiment.
How large?
Let's continue to use the observations
of HD 209458b by
Blain et al., arXiv 2408.13536 (2024)
as an example.
The contrast in transit depth between in-line and out-of-line
measurements is roughly 1.6 x 10⁻⁴,
which implies that we must collect
at least
N = 3.8 x 10⁷ photons
in order to detect the signal reliably.
If we choose a bandpass of width
Δλ = 0.3 Å
to match the expected size of atmospheric features,
then we find for a star
of apparent magnitude mH = 6.366
the flux of photons inside the bandpass will be roughly
                         photons
      flux  f  =  0.08  ------------
                         s * sq.cm.


  Q:  How long will it take to collect N = 3.8 x 10⁷ photons
            with a telescope of diameter 1 m?   10 m?


                           D = 1 m                  D = 10 m
-------------------------------------------------------------------
 Area (sq.cm.)

 Rate (photon/s)

 Exptime for N (s)
-------------------------------------------------------------------
My answers
It is clear that hunting for exoplanet atmospheres
is a job for very large telescopes ...
but
given these numbers,
it seems that with the largest current
telescopes (diameters greater than 5 or 8 meters),
it ought to be possible
to make several measurements over the course
of a transit which would detect a single line
cleanly.
In fact, the calculations above do not tell the whole
story:
they have been simplified in several ways and avoid
dealing with some issues that arise in the real world:
- these calculations include only Poisson noise in
the signal from the host star. Real observations
must deal with background and instrumental noise.
- we've ignored extinction by the Earth's atmosphere
(for ground-based measurements)
and by the interstellar medium (for all measurements)
- we've assumed that telescopes, optics, and detectors
are all 100% efficient.
Real devices -- especially complex spectrographs --
never reach this ideal limit.
Overall instrument efficiencies can fall below
10%
So, in fact,
when one runs through these calculations
using reasonable values for the parameters,
rather than ideal ones,
one discovers that even our largest
telescopes would have difficulty detecting
a single absorption line with any confidence
in any known exoplanet system.
Is the whole endeavor hopeless?
Are astronomers just wasting their time?
Or is there something else we can do?
Fortunately,
scientists have devised clever tricks
that can help us to detect the presence
of exoplanetary atmospheric features in the spectrum
of a host star.
Once again,
let's turn to
Blain et al.'s
study of HD 209458b.
To start,
the authors use a very large telescope
at a very good ground-based site:
one of the 8.2-meter VLT units in the Atacama Desert of Chile.
They choose a system with a relatively bright
host star
(mV = 7.65, mH = 6.37)
in order to boost the signal.
The exoplanet is known to be a hot Jupiter,
which suggests that its atmosphere ought to be
massive and extended.
The spectrograph in this study,
CRIRES+,
provides very high spectral resolution.
Operating with a narrow slit,
they worked at roughly R = 100,000,
allowing them to resolve features
in the H-band as narrow as 0.16 Å.
That's a good match to the expected widths of
absorption lines produced by the planet's atmosphere.
Now, here's the real key:
rather than attempting to measure just one
line at a time,
the authors effectively measure tens or hundreds
of lines simultaneously,
greatly increasing their ability to detect faint signals.
The method goes like this:
- acquire several hundred brief (30-60 second) exposures
of the host star before, during, and after the transit
- create a model spectrum of the host star
- create a model spectrum of the planet,
using some assumed mixture of species such as CO, H2O,
etc.
Now, for each observed spectrum, taken at time t,
- shift the planet's spectrum by the amount expected
for its radial velocity at t
- add that shifted planetary spectrum to the fixed
spectrum of the host star
- cross-correlate this composite model spectrum
with the observed spectrum at time t
- accumulate the results of the cross-correlation
If the model of the planetary atmosphere was a good match
to the ACTUAL planetary atmosphere,
then each of the cross-correlations in the step "C"
above should yield some positive result.
Yes, due to random noise,
some of the spectra might produce correlations
of zero, or even negative values;
but note that the team acquired
several hundred spectra each night.
Their final result, moreover,
was based on spectra gathered on four good nights,
each covering one transit.
As a check on the procedure,
one can also run through the same steps,
but make one crucial change:
in step "A",
rather than shifting the planet's model spectrum
by the expected radial velocity,
one can shift it by some other, incorrect, velocity.
In that case,
the shifted model features should NOT line with any observed
features,
and the cross-correlation should yield
a result of negligible or negative significance.
An example of this check is shown in the Figure A.2
from Blain et al., below.
the Doppler shift applied to the planetary spectrum
is varied along the horizontal axis,
time during the night runs along the vertical axis
(from bottom to top),
and the colors show the value of the cross-correlation.
Note that the positive (blue) correlations
only appear when the planetary model has been
shifted by an amount which varies over the course
of the transit --
just as we would expect from
its orbital motion.
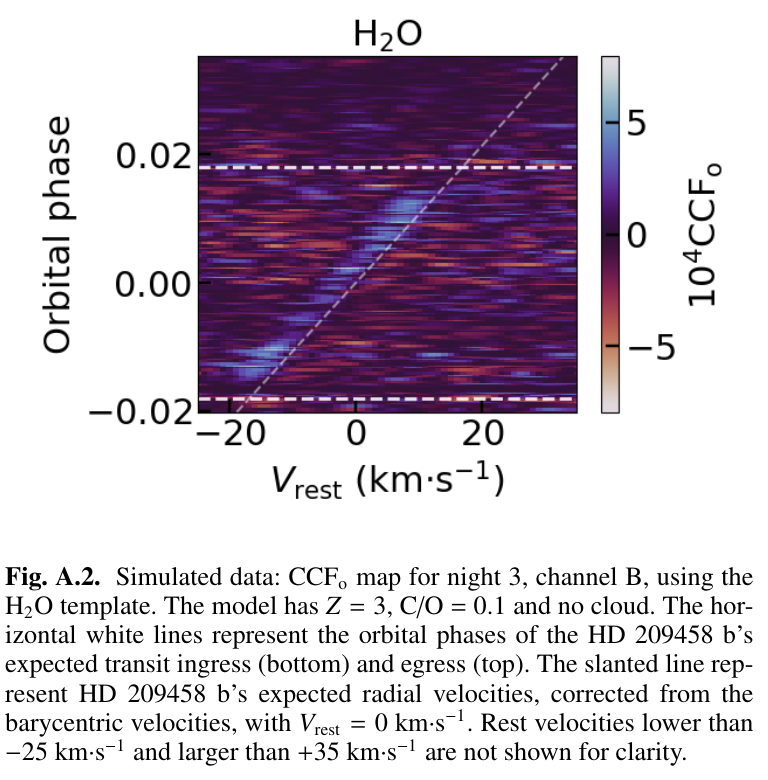
Figure A.2 from
Blain et al., arXiv 2408.13536 (2024)
Of course, this entire method of analysis
depends crucially on step "2" in the list above:
creating a model spectrum of the planetary atmosphere.
If our model includes H2O, but the real
atmosphere does not,
then no amount of shifting will yield a
significantly positive correlation.
Thus, this technique involves one more layer of
iteration:
- guess some mixture of atmospheric components
- run the entire shift-and-correlate procedure
- if the result is not significant,
go back to step I with a different guess
Interpreting the results can be difficult.
In Figure 7 from
Blain et al.,
the authors present the results for
several possible components of the atmosphere in
HD 209458b.
In these graphs,
blue regions denote positive, and red regions negative, correlations.
The axes have been chosen so that real signals
from the planet ought to appear near the location
where the dashed white lines cross.
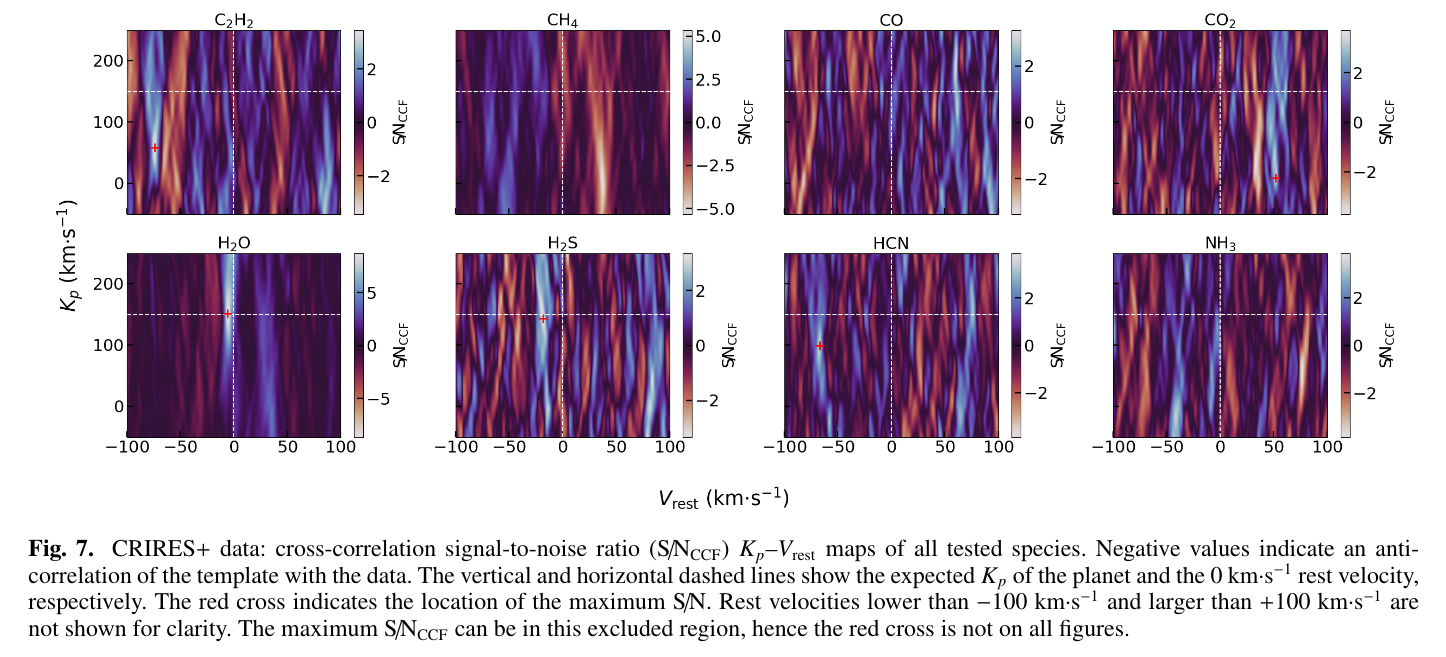
Figure 7 from
Blain et al., arXiv 2408.13536 (2024)
We (and Blain et al.) can conclude that
H2O is definitely present in the planet's atmosphere,
and that
H2S might be present,
but that there is no evidence
for a detection of CO or HCN.
- Some good sources of terrestrial atmospheric transmission
are:
- Computing the number of photons collected for a star of
a certain magnitude observed in a certain band requires
the use of magnitude zero points.
Some good resources are
- More information on the shapes of spectral lines can be found at
- Many of the examples in this lecture are based on
 Copyright © Michael Richmond.
This work is licensed under a Creative Commons License.


 Copyright © Michael Richmond.
This work is licensed under a Creative Commons License.


